A chart can be used to graph numeric client information collected in Bp Allied over a number of consultations, e.g. weight.
If new information is to be displayed in the chart, save the client details and click Show Chart to refresh the information displayed.
|
Field |
Description |
|---|---|
|
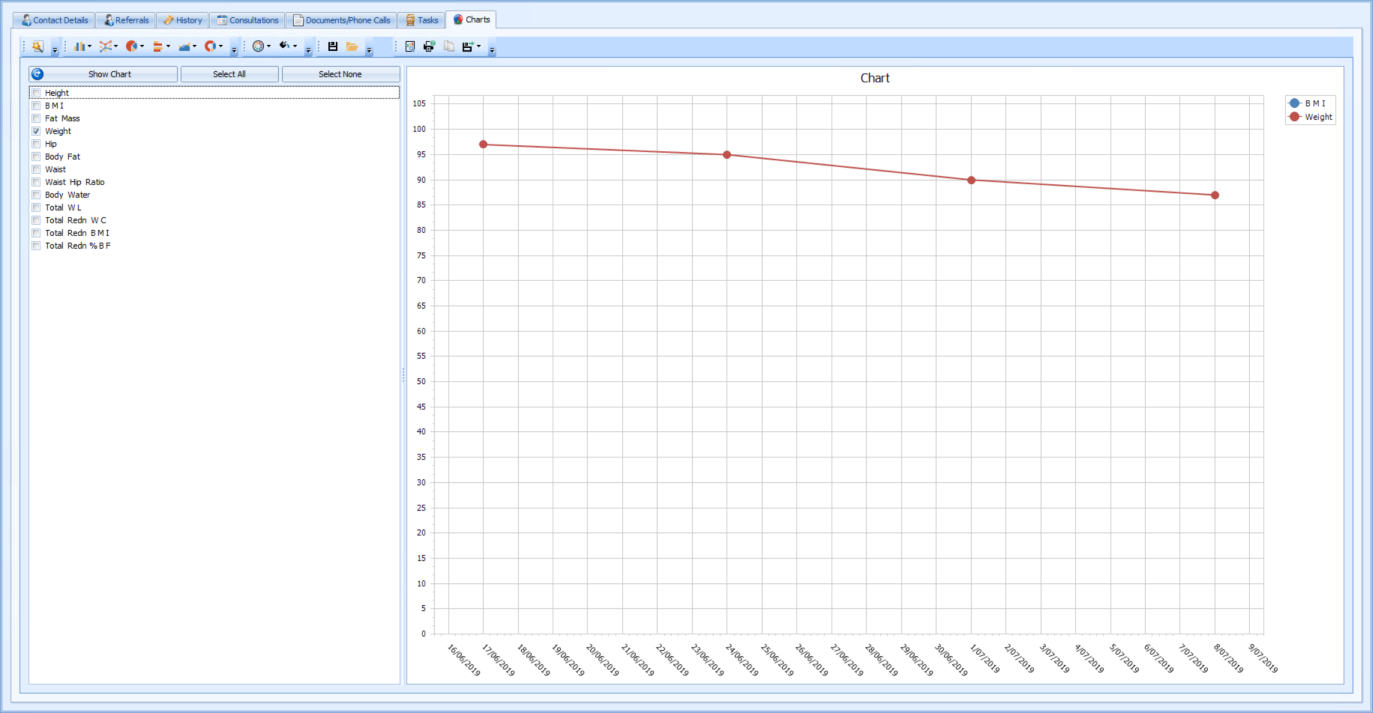
Items to include in chart |
Tick the boxes for the fields to include in the chart. In this example Weight is displayed. |
|
Show Chart |
Click Show Chart to display the ticked items. |
|
Chart |
A chart displaying Weight over time. The appearance can be changed via the Chart Wizard, Chart Types and Appearance Options. |
|
Chart legend |
The chart legend indicates which field is displayed in which colour in the Chart. This can be changed via the Chart Wizard. |
|
Chart Wizard |
Use the Chart Wizard at any time to change the details about the chart including the Title, Axis Labels, Legend and much more.
|
|
Chart Types |
Change the type of a chart using these options, e.g bar chart, line chart or pie chart. Your choice will depend on the information being displayed.
|
|
Appearance options |
Use these to change the colour scheme from the defaults.
|
|
Save and Options |
A chart template can be saved for future use via the Save button and retrieved via the Open button.
|
|
Output options
|
|


 - Previews the Chart in Print Preview
 - Print
 - Copy the Chart. This can then be pasted into a document created in Letters.
 - Export the chart out of Bp Allied into one of the options given including PDF, XLS and XLSX.
The following provides more information about the calculation logic used by this clinical tool, which may assist in assessing suitability for use at your practice.
Body Mass Index
Description: Body Mass Index (BMI) is calculated from a patient’s height and weight as an indicator of body fatness.
Source: BMI is a commonly used calculation. The World Health Organisation provides a description of the BMI.
Calculation: Body Weight (kg) / (Height (metres) ^2) for Australia and New Zealand


 AU
AU 