A chart can be used to graph numeric client information collected in myPractice over a number of consultations, e.g. weight.
 If new information is to be displayed in the chart save the client details and Click Show Chart to refresh the information displayed.
 Items to include in chartTick the boxes for the fields to include in the chart. In this example Weight and BMI are displayed.
|
 Show Chart button-
Click Show Chart to display the ticked items. -
Select All - will select all of the items available to include in the chart
-
Select None - will deselect all of the items available to include in the chart
|
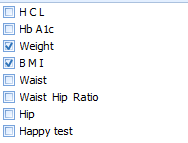
 Chart
A chart displaying Weight and BMI over time
The appearance can be changed via the Chart Wizard, Chart Types and Appearance Options.
|
 Chart LegendThe chart legend indicates which field is displayed in which colour in the Chart
-
This can be changed via the Chart Wizard
|
 Chart WizardUse the Chart Wizard at any time to change the details about the chart including the Title, Axis Labels, Legend and much more.
|
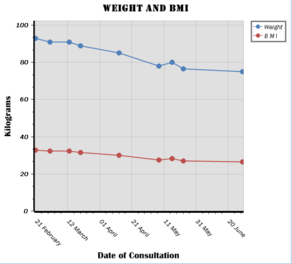
 Chart TypesChange the type of a chart using these options e.g bar chart, line chart or pie chart. Your choice will depend on the information being displayed.
|
 Appearance OptionsUse these to change the colour scheme from the defaults.
|
 Save and OpenA chart template can be saved for future use via the Save button and retrieved via the Open button.
|
 Output Options - Previews the Chart in Print Preview  - Print  - Copy the Chart. This can then be pasted into a document created in Letters  - Export the chart out of myPractice into one of the options given including PDF, XLS and XLSX |
|