Grouping a View or a Report
All reports within Bp Allied can be
filtered and grouped which provides you with a more powerful reporting tool. There are also a number of views that use these functions as well, for example, Referrers or Products and Services in Data Maintenance. This section covers how to use the Group by function.
Grouping a Report/View will display the report based on the column you wish to group by. Any report or view that has the dark blue* header row, as shown below, is able to be manipulated using the Group By options.
* assuming that the default Blue skin is being used
To group a Report or View
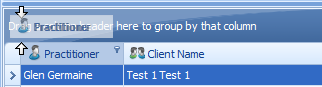
Click on the Column header to be used as the Group
Drag the Column header into the Grouping row (below) which reads "Drag a column header here to group by that column"
Drop (or let the mouse go)
The Column header will now display in the Group by row and the report results will be grouped by that column (as shown below)
For example:
To find the Sales figures for each Practitioner you would need to group the Item Sales Report by Practitioner.
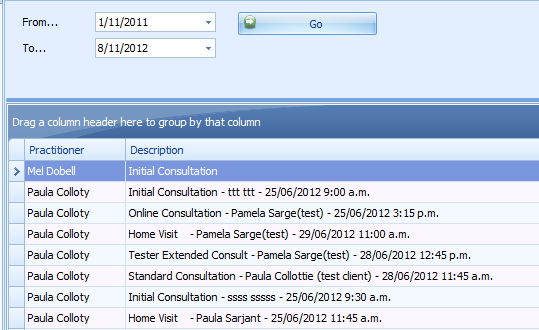
Open the Item Sales Report
Enter in a date range
Click Go
The Item Sales Report results display
To Group the report drag the Practitioner column heading into the area above which reads "Drag a column header here to group by that column".
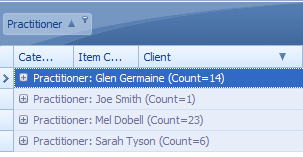
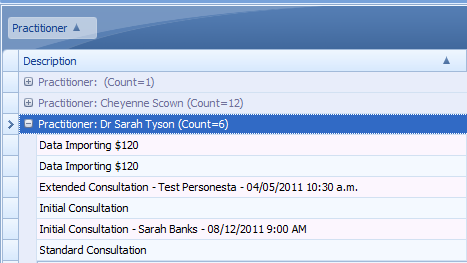
The Item Sales Report Grouped by Practitioner then displays like this
You can expand the grouping by clicking on the plus sign.
The report can be grouped further.
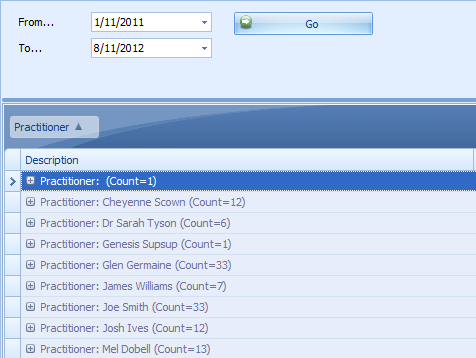
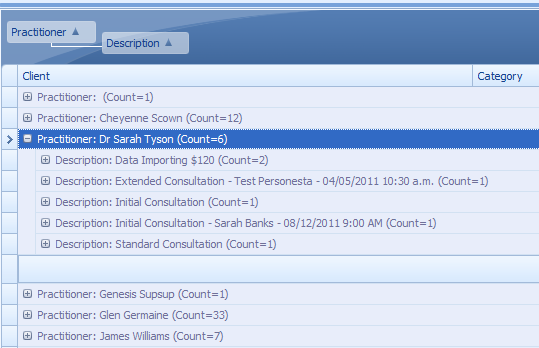
In this example of the Item Sales Report you may wish to see the sales figures for each practitioner, but you may also wish to see which particular products or services are selling more than others. To do this, drag the Description column header into the same area but just below the Practitioner Column header and release the mouse
The Item Sales Report Grouped by Practitioner and Description then displays like this
To Ungroup a Report or View
To ungroup the report drag your column headings back to the column heading area.