
This article describes the types of Appointment statistics reports available in Bp Premier.
The Appointment Statistics reports shows the total number of appointments and appointment hours per provider per month, and the total number of appointments and appointment hours by type, per provider at your practice.
There are two appointment statistics reports available: combined locations and individual locations. The combined locations report provides overall totals for all locations whereas the individual locations report includes separate tables and totals per location.
In this article:
Set up users to access appointment statistics reports
To access reports, you must have the Reports permission set to Allow access, and you must have reports set up via Setup > Users > Edit > Set Reports.
- From the Bp Premier home screen, select Management > Reports. The Bp Premier Reports screen will appear.
- Select the report you wish to view from the Available reports list. Depending on the report, the Choose the Report Parameters screen may appear.
- If the Choose the report Parameters screen appears, select your required report parameters from the Date, locations and Providers, Billing, Banking and Configuration tabs, and click View Report.
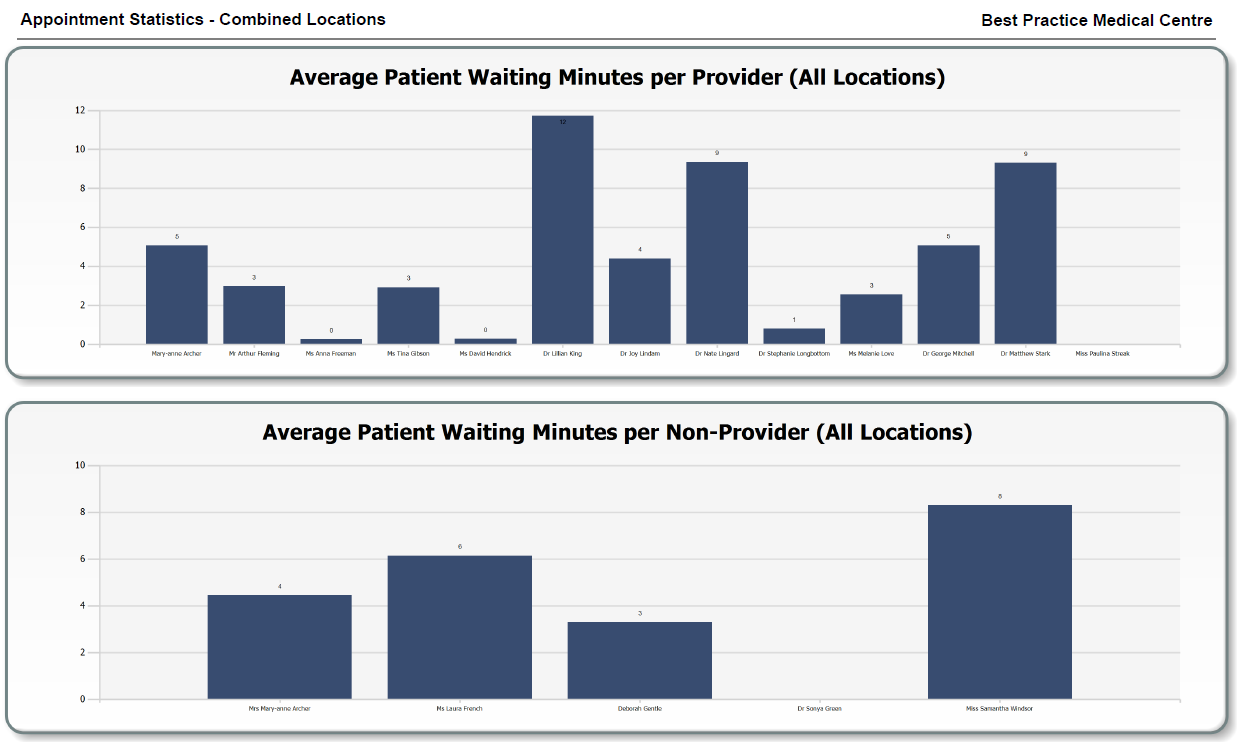
Appointments Statistics - Combined Locations
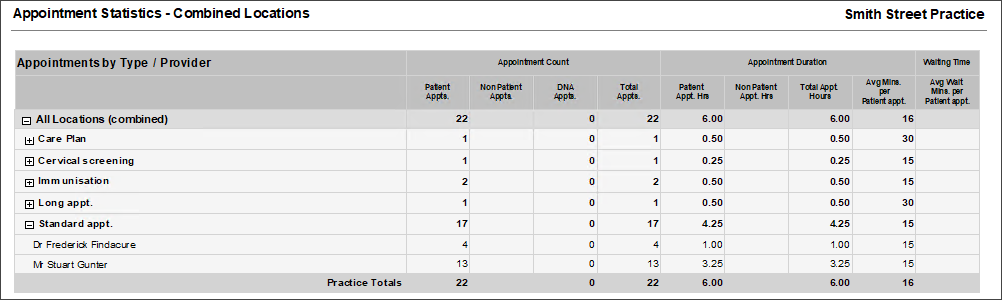
This report will display statistics related to Appointments, including Appointment count (patient, non-patient, DNA Appointments and total); Appointment duration (hrs) (patient, non-patient and total); Average Minutes per patient appointment and Average Waiting time per patient appointment.
The data is presented in two data reports – Appointments by Provider / Month and Appointments by Type / Provider.
If the ‘Expand all’ option is used on the Billing tab of the configuration screen, the Appointments by Provider / Month will expand to show the Appointment date.

Graphs
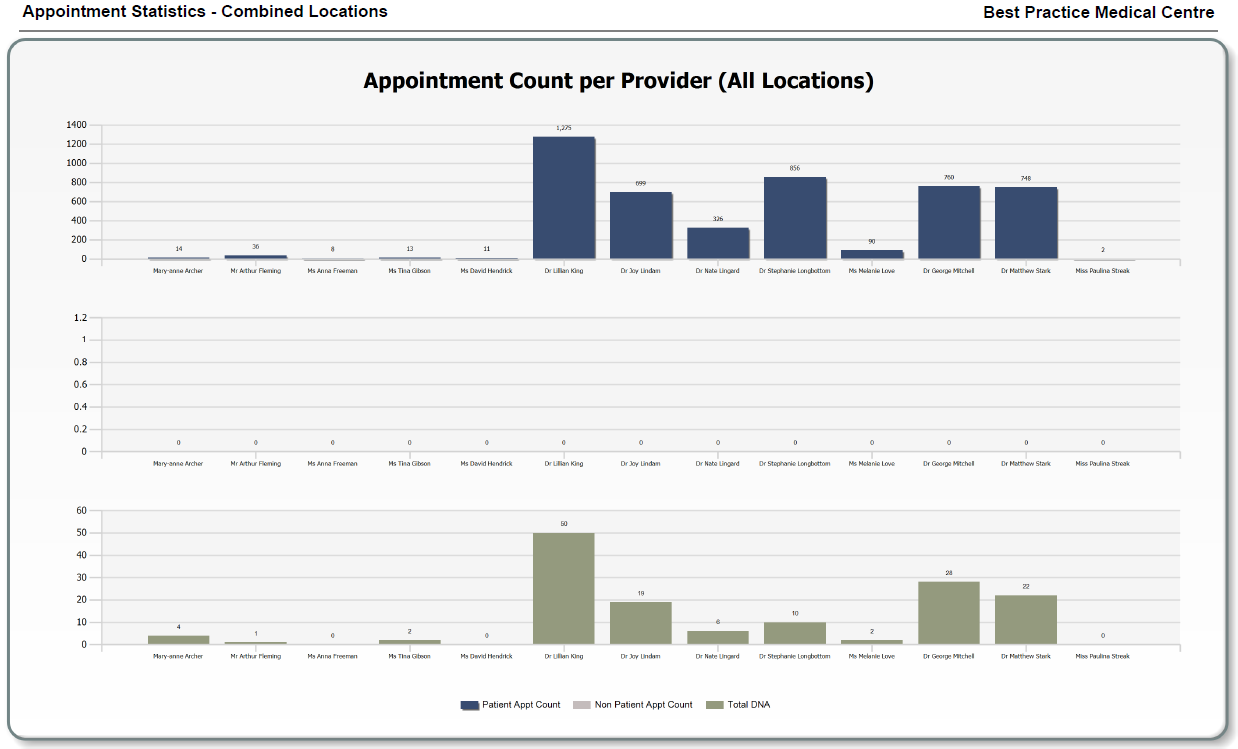
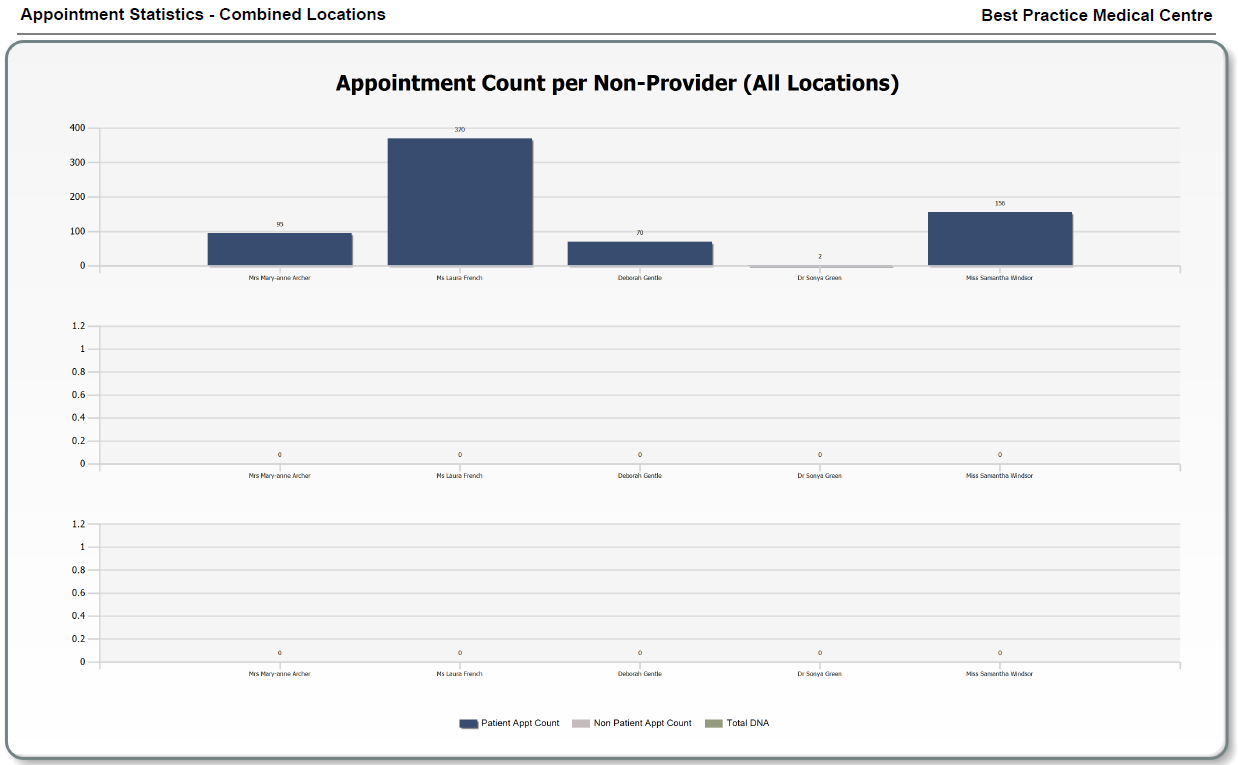
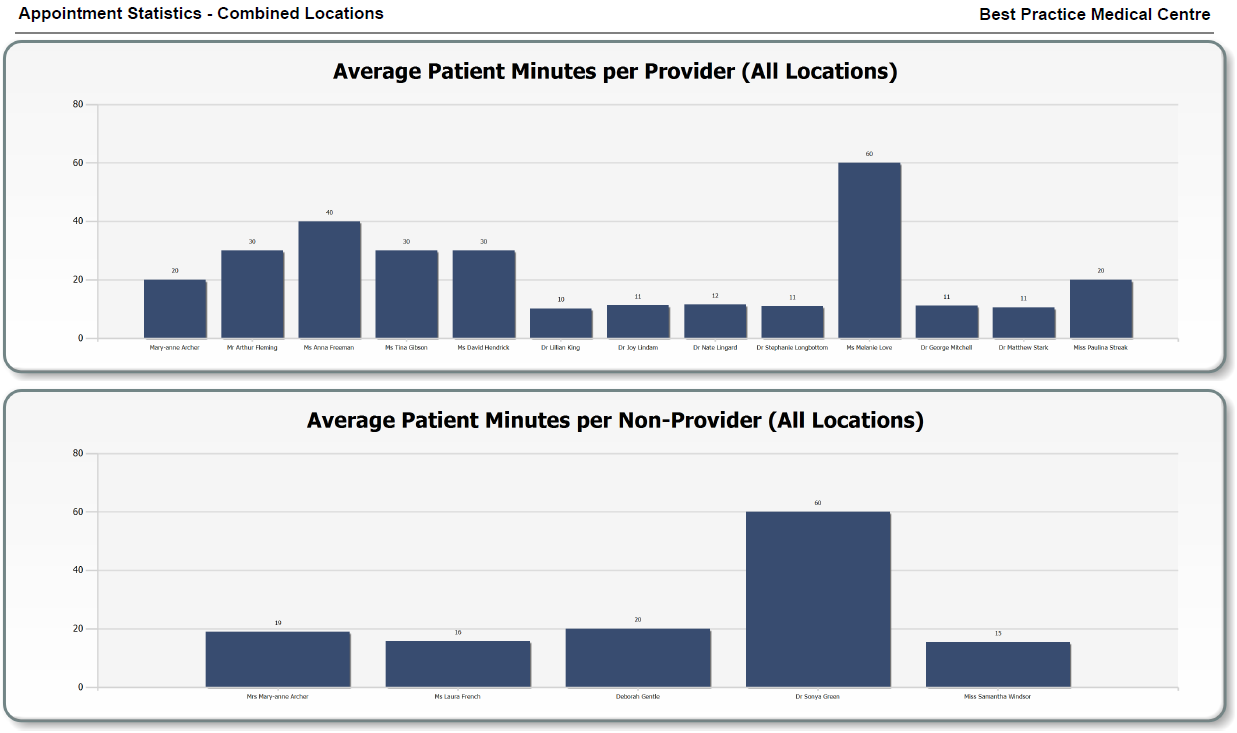
The appointment statistics reports include graphs generated from appointment data. These include:
- appointment count per provider (all locations)
- appointment count per non-provider (all locations)
- average patient minutes by provider (all locations)
- average patient minutes by non-provider (all locations)
- average patient waiting minutes per provider (all locations)
- average patient waiting minutes per non-provider (all locations).
The Individual Locations report will print a separate graph per location whereas the Combined Locations report will combine statistics for each provider together.
Below are some examples of how these graphs may look (click images to enlarge).
|
|
|
|
|
|
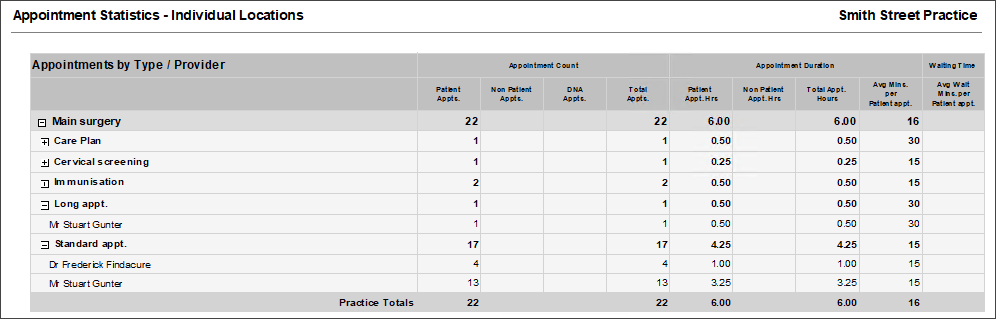
Appointments Statistics - Individual Locations
This report will display statistics related to Appointments, including Appointment count (patient, non-patient, DNA Appointments and total); Appointment duration (hrs) (patient, non-patient and total); Average Minutes per patient appointment and Average Waiting time per patient appointment.
The data is presented in two data reports – Appointments by Provider / Month and Appointments by Type / Provider.
If the ‘Expand all’ option is used on the Billing tab of the configuration screen, the Appointments by Provider / Month will expand to show the Appointment date.

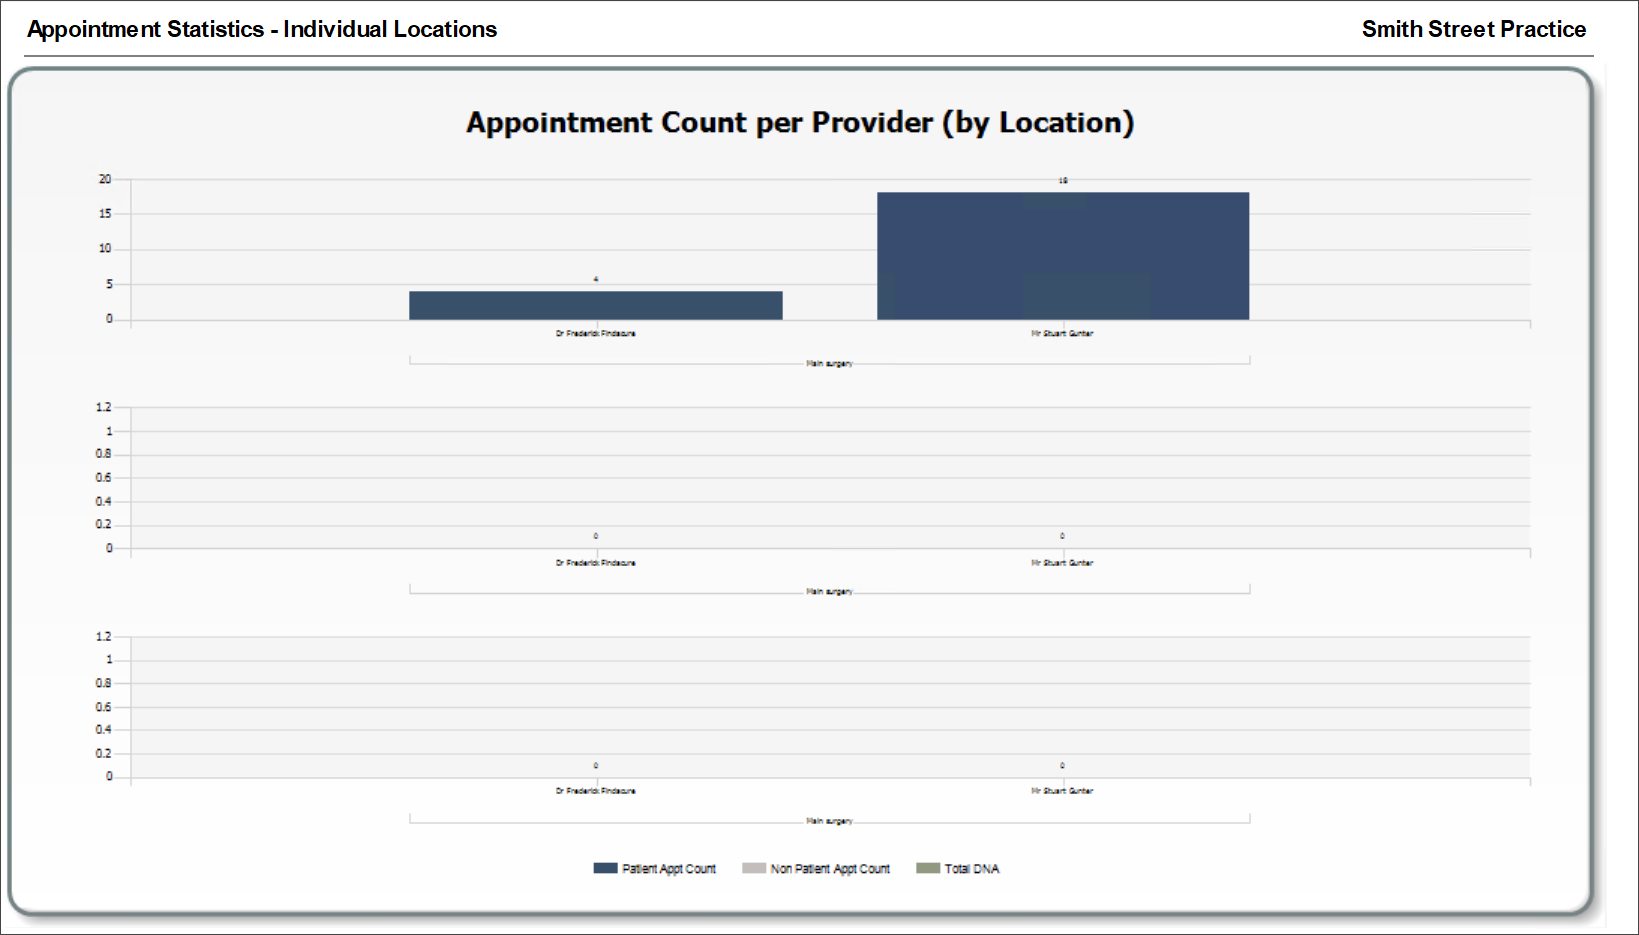
Graphs
The appointment statistics reports include graphs generated from appointment data listed above. These include:
- appointment count per provider (by Location)
- appointment count per non-provider (by Location)
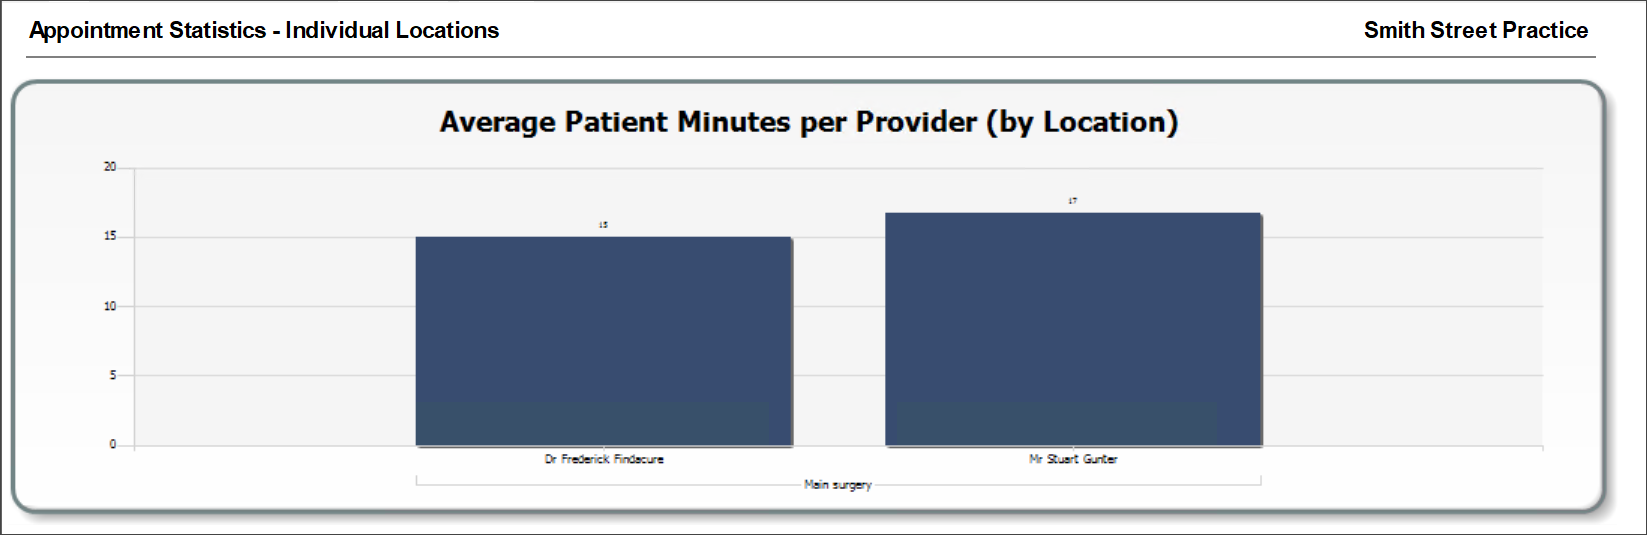
- average patient minutes by provider (by Location)
- average patient minutes by non-provider (by Location)
- average patient waiting minutes per provider (by Location)
- average patient waiting minutes per non-provider (by Location).
The individual locations report will print a separate graph per location whereas the combined locations report will combine statistics for each provider together.
Below are some examples of how these graphs may look (click images to enlarge).
|
|
|
Last updated: 09 April 2025.


 AU
AU 