All reports within Bp Allied can be filtered and grouped. A number of views can also be grouped, for example, Referrers or Products and Services in Data Maintenance.
On this page
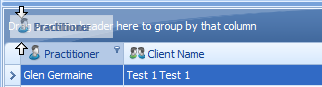
Assuming that the default Blue skin is being used, any report or view that has a dark blue header row, as shown below, offers the Group By options.
![]()
Group a report or view
- Click on the column header to be used as the Group.
- Drag and drop the column header into the Grouping row (shown below) which reads "Drag a column header here to group by that column".
- The column header will now appear in the Group by row and the report results will be grouped by that column.
An example using the Item Sales Report
To find the sales figures for each Practitioner, group the Item Sales Report by Practitioner:
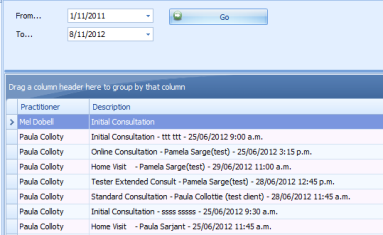
- Open the Item Sales Report.
- Enter in a date range.
- Click Go.
- The Item Sales Report results appear.
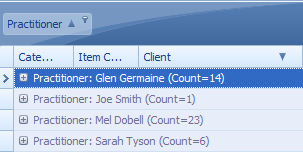
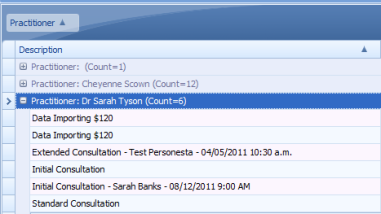
- Drag the Practitioner column heading into the area which reads "Drag a column header here to group by that column". The Item Sales Report Grouped by Practitioner will be generated.
- Expand the grouping by clicking on the plus sign.
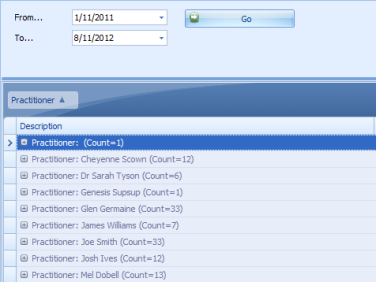
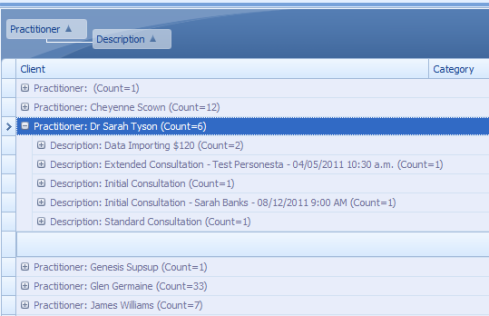
- The report can be grouped further. For example, you wish to see the sales figures for each Practitioner, and also wish to see which particular products or services are selling more than others.
- Drag and drop the Description column header into the same area, but below the Practitioner column header.
Ungroup a Report or View
To ungroup the report, drag the column headings back to the column heading area.


 AU
AU 