myPractice has been rebranded Bp Allied, a product of Best Practice Software.
Support is available Monday to Friday, 9am to 5pm AEST Version 4.18 Published 5 December 2019
Email: alliedsupport@bpsoftware.net Click RemoteSupport from within myPractice for assistance Phone: 1300 40 1111 (in Australia) or 0800 40 1111 (in New Zealand)
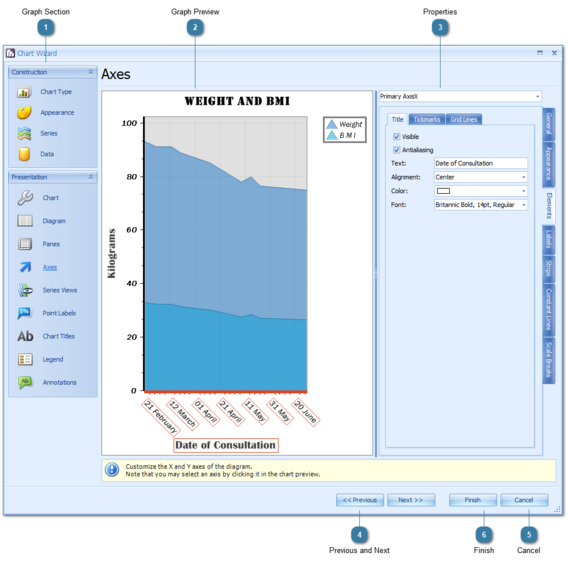
Chart Wizard
There are many in's and out's to the chart wizard hence not all of the details is going to documented here. What is included is the information on how to do specific things, e.g. Edit the chart title, add a label to an axis and change the font of these or change the dates included in the series of data displayed.
Graph Section
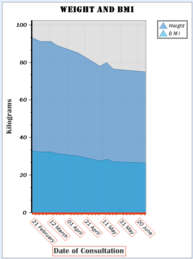
Each of the sections displayed in the Construction and Presentation pane can be edited in the Chart Wizard. The table below show where to go within the Chart wizard to change specific things.
What to change
Where to get to it
The first option on bold e.g. Go to Axes is selcted from the Construction/Presentation pane, any subsequent options are selected from the Properties pane discussed below.
Add chart title and change font
Go to Chart Titles > Text tab
Type into the text box that by default displays the text "Chart. This should automatically update the title displayed in the Graph Preview
Click General tab > Font to change the titles font
Click Add to add a second title to the chart (and Remove to delete it)
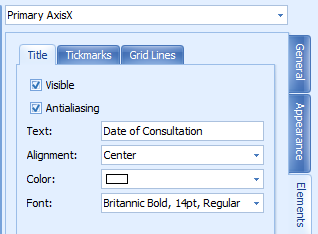
Add an axis title and change font
Go to Axes > Elements
Select the Axis required for editing from the dropdown at the top
AxisX = Horizontal axis
AxisY = Vertical axis
Tick the Visible tickbox
Edit the Text box as required
Change the dates used for the data displayed
Go to Axes > General tab > Range
Dates should appear on the Primary AxisX
Untick Auto
Change the Min / Max dates as required. Leave the time portion of the date as it defaults in
Change the Legend font
Go to Legend > Text
Change the way a series is plotted e.g for a line graph
Go to Series Views > Appearance
Change the minimum weight used for the data displayed
Go to Axes > General tab > Range
At the top change the drop down to Primary AxisY as this is the vertical axis and should display the weight details against it.
The Properties or options that can be changed about each part of the graph are changed in this section of the Chart Wizard. There are two sets of tabs - ones on the right-hand side and ones at the top. When navigating around choose a tab from the right-hand side first followed by one at the top.
Used to navigate through each section of the Chart Wizard. These can be over ridden by choosing a section from the Construction/Presentation pane of the Wizard.