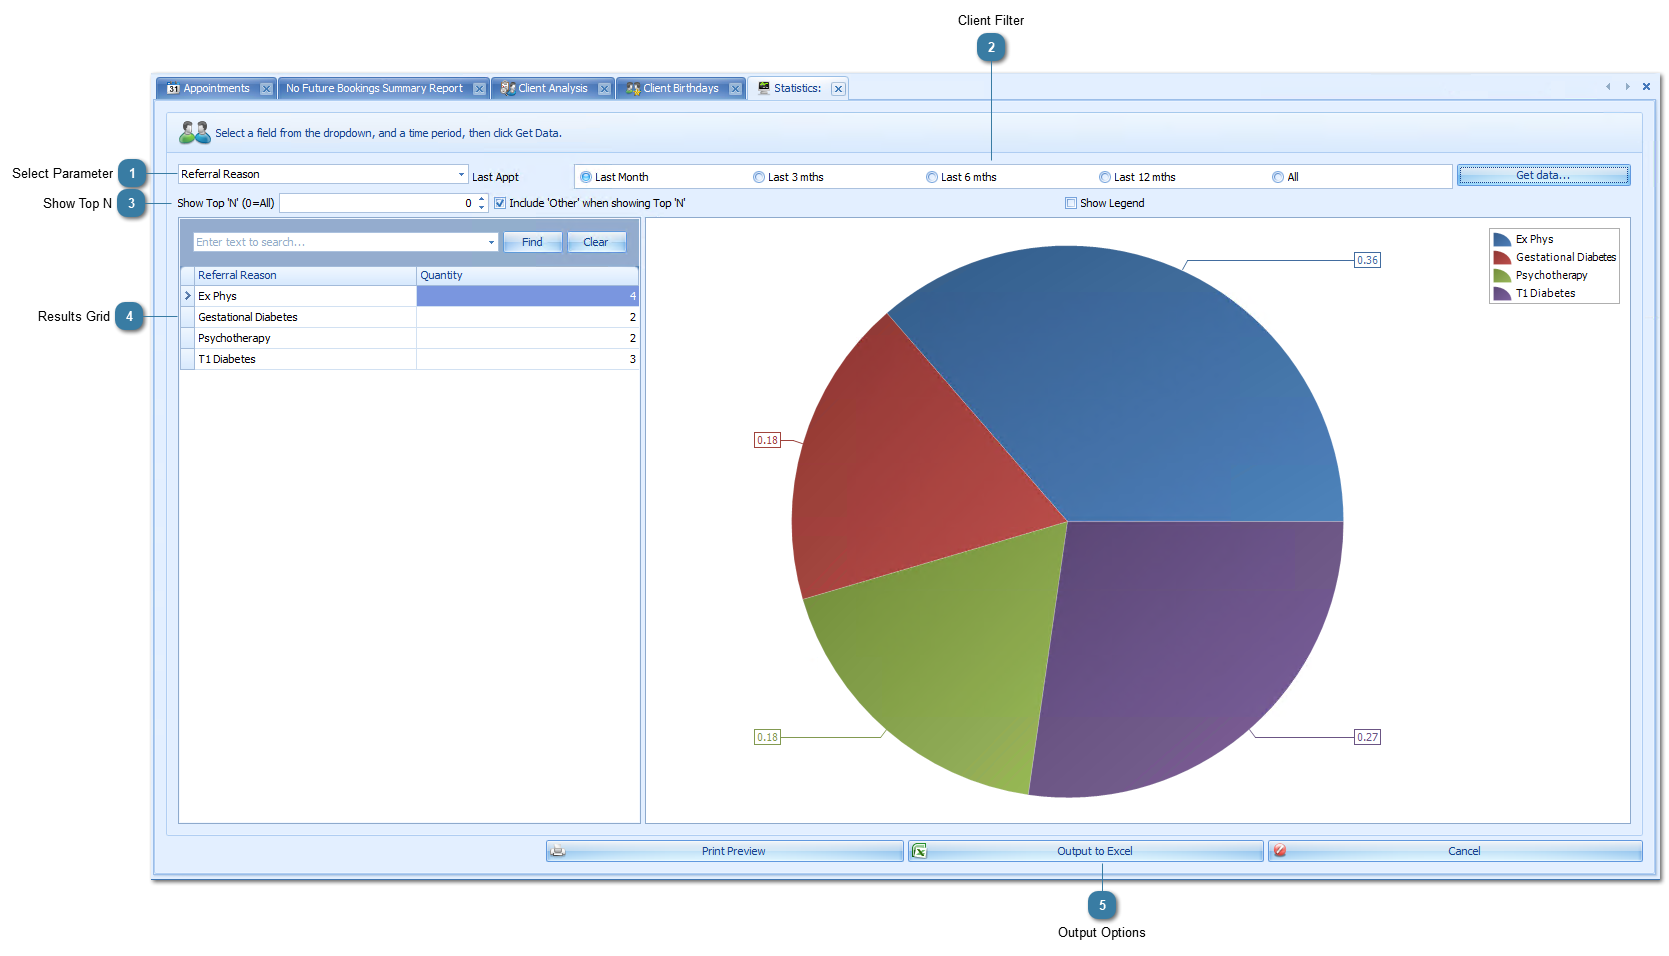
Using the Statistics Report
This report is designed to show in graphical form the breakdown of various client parameters, e.g. Medications or Medical Conditions. Details of the clients included in these statistics can be viewed from the
Analysis report.
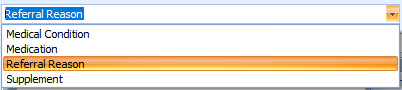
 Select ParameterSelect the parameter to be measured.
|
|
 Client FilterSelect the period of time to filter the parameters for.
|
|
 Show Top NIf there is a long list of results, e.g. many different medications, then changing the value can be used to display the top 10 or 20 etc results.
Ticking the Include Other when showing Top N tickbox gives the option to include all other values that fall outside this list as a group and displayed as "Other".
|
|
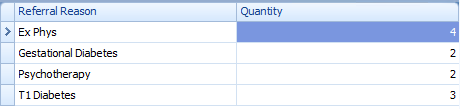
 Results GridShows the incidence of each value of the parameter selected.
|
|
 Output Options |
|