
This article explains how to set up and use reports available in Bp Omni.
To access reports in Bp Omni, select Reports from the top toolbar, or go to Menu > Reports.

In this article:
Allow user access to reports
You must log in as a user with the Security role of Owner, Administrator, or Practice Manager to access all reports and share reports with other users in the practice.
- Select your profile icon in the top-right corner of the menu bar and select Settings. The Users screen will appear.
- Enter the user name in the search box, and click to edit.
- Enter the user’s Business roles in the User role & security permissions section.
Business roles define the user's access privileges and are used for security. Users who have a clinical role, for instance, will have access to patient records.
- To allow the user to manage published reports and view preset reports, set the Reports security permission to Administrator.
- To allow the user to view reports and save their own copies, set the Reports security permission to View Only.
- Click Save.

See Configure Business Roles and Security Permissions for more information.
Report types
There are four different types of reports in Bp Omni. Use the search bar to find a report or select a report from the menu options.
Access to all report types is granted to users who have the security roles of Owner, Administrator, or Practice Manager. Users with less privileged security roles will only be able to see My Reports and Public Reports.
|
My reports |
My reports are only viewable by the user who saved them. They are reports that have been saved from either Preset or Public reports. They are not available publicly. My reports can be created by users without administration permissions by saving a public report, and by users with administration permissions by saving a public, Preset report. My reports can be deleted. |
|
Public reports |
Public Reports are reports that have been saved from Preset reports, and have been made public when saved. Public reports are available to users without administration permissions, and can be deleted. |
|
Preset reports |
Preset reports are a collection of reports created by Best Practice Software. Preset report categories include:
Only administrators can view Preset reports. |
|
Summary reports |
Summary reports are available for Invoices and Payments. Table data cannot be customised or saved into My reports. |
Report management
Filtering and customisable table options can be applies and saved for Preset, Public and My reports. The filtering options available will depend on which report is used.
A timestamp of when the report data was last updated can be found in the bottom left corner of the Reports screen.

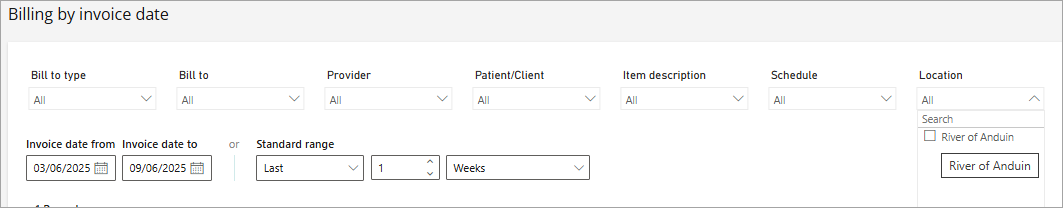
Set the date range for a report
Two options are available for selecting a date range for reports in Bp Omni. You can select a From and a To date, or you can choose a Standard range, for example, the last three calendar months.
The Standard range is relative to the current date. For example, if it is mid-August and you set the standard range to the last calendar month, the report will show data for July. If you go back and run the report again in mid September, the report will show data for August, without the need to change any date settings.
If you choose a standard range, the From and To dates will change to reflect the dates that are included in the Standard range.

Customise table data
You can modify the columns that are included in a report based on your requirements.
NOTE Only administrators can add new columns to reports. Table data cannot be customised for Summary reports.
- Click Customise table on the right-hand side of report. The Customise table screen will appear.
- To add new columns to the report, drag an option from the Hidden Columns section on the left into the Active Columns section on the right.
- To remove columns, drag an option from the Active Columns section into the Hidden Columns section.
- You can also drag an option into the Group by section to group rows related to these columns together.
- Click Apply to implement your changes in the report.

The available column options will differ depending on the type of report you are using.
TIP Mac users must double click the column name instead of using the drag and drop function to move columns.
Further filter options
Further filtering options can be accessed by hovering your cursor over filter or table headings.
|
Icon |
Tooltip |
Report |
Description |
|---|---|---|---|
|
|
Drill up |
Summary reports. |
Collapses expanded headings in hierarchy. |
|
|
Drill down |
Summary reports. |
Enables Drill Mode. Select a data point on the grid to drill for further information. |
|
|
Go to the next level in the hierarchy |
Summary reports. |
Expands the grid columns to the next level heading in the hierarchy. |
|
|
Expand all down one level in the hierarchy |
Summary reports. |
Click to expand headings and display additional columns.
Click the Drill up icon to collapse headings. |
|
|
Filters and slicers affecting this visual |
My reports, Public reports, Preset reports, and Summary reports. |
Shows all current filters applied to grid.
|
|
|
Personalise this visual |
Invoice summary report. |
Click to customise table grid options. |
|
|
Focus mode |
My reports, Public reports, Preset reports, and Summary reports. |
Expands table grid data to full screen. |
|
|
Further options |
My reports, Public reports, Preset reports, and Summary reports. |
Further options include:
|
|
|
Clear selections |
My reports, Public reports, Preset reports, and Summary reports. |
Clears all filter options selected for a filter group. |


Public and My reports
Filtering and customised table options applied to a Preset report can be saved to:
- Public reports - Available for all users.
- My reports - Available only to the creator.
Public reports can also be restricted so that the provider accessing the report can only see information relevant to them.
- Click Save As or click the down arrow beside Save and select Save a copy . The New report screen will appear.
- Enter a Report name.
- Tick or untick the Public checkbox:
- If you only want the report to be available to you, ensure Public is unticked and click Save. The saved report will appear in the My reports section.
- If you want the report to be available to other staff members, tick Public. If the report contains appointment, billing, or payment information, the Row Visibility menu will appear.
- If the Row Visibility menu appears, select whether the person viewing the report will be able to see all rows, or just the rows related to the logged in provider.
- Click Save. The saved report will appear in the Public Reports section or the My reports section depending on which option was selected.

Export, save or delete a report
Function buttons to export, save, or delete reports can be accessed from the top right-hand corner of the Reports screen. These options are not available for Summary reports.

See the table below for a full list of function buttons. All exported files are saved to your local Downloads folder.
|
Button |
Report type |
Description |
|---|---|---|
|
Xero |
Payment and Billing Preset reports, Public reports. |
Creates .csv file to be imported into Xero. See Exporting Reports to Xerofor more details. |
|
|
My reports, Public reports, Preset reports. |
Creates PDF document. |
|
Excel |
My reports, Public reports, Preset reports. |
Creates .xlsx document to open in Excel. |
|
Save |
My reports, Public reports. |
Saves updates made to filters and table customisation in the current report. |
|
Save a copy |
My reports, Public reports. |
Saves a new copy of the current report. |
|
Save as |
Preset reports. |
Saves a copy of the current Preset report including filters and table customisation. Report can be saved as a Public or My report. |
|
Delete |
My reports, Public reports. |
Deletes the current report. |
NOTE The ability to Save or Delete Public and My reports will depend on user access. See Configure Business Roles and Security Permissions for more information.
Summary reports
Summary reports, including the Invoice and Patient summaries, have the following limitations:
- They cannot be saved to Public Reports or My Reports.
- They cannot be customised.
- They cannot be exported to Xero or Excel.

See the table Further filtering options for a full list of options available for Summary reports.
Report Dashboards
Report dashboards display a variation of graphs that can be filtered by clicking on the recorded graph data.

Ask a question
Data displayed in the dashboards can be queried further via the Ask a question button.
- Click the Ask a Question button to open the natural language query search screen and ask a question about your data, or choose a suggestion. Select Show all suggestions to see more.
- When you begin typing your question, the search bar will display predictive search results to assist your query. Click a suggestion or continue typing your query.
- Press the enter key on your keyboard, or click the submit arrow to view the search results. Hover over individual records for further details.


TIP Typing 'as a table' at the end of your query will display the search results in a table format.
Natural language query writing
See the table below for key words and search terms to use when asking a question about your data.
|
Category |
Keywords |
|---|---|
|
Aggregates |
total, sum, amount, number, quantity, count, average, most, least, fewest, largest, smallest, highest, biggest, maximum, max, greatest, lowest, littlest, minimum, min |
|
Articles |
a, an, the |
|
Blank and Boolean |
blank, empty, null, prefixed with "non" or "non-", empty string, empty text, true, t, false, f |
|
Comparisons |
vs, versus, compared to, compared with |
|
Conjunctions |
and, or, each of, with, versus, &, and, but, nor, along with, in addition to |
|
Contractions |
didn't, haven't, he'd, he's, isn't, it's, she'll, they'd, weren't, who's, won't, wouldn't |
|
Dates |
Most date terms are searchable such as day, week, month, year, quarter, decade including variations of written and numerical date formats. |
|
Relative dates |
today, right now, current time, yesterday, tomorrow, the current, next, the coming, last, previous, ago, before now, sooner than, after, later than, from, at, on, from now, after now, in the future, past, last, previous, within, in, over, N days ago, N days from now, next, once, twice |
|
Equality (Range) |
in, equal to, =, after, is more than, in, between, before |
|
Equality (Value) |
is, equal, equal to, in, of, for, within, is in, is on |
|
Names |
Search or query the data with a patient first or surname to ask questions such as 'Which patients are named John?'. |
|
Pronouns |
he, him, himself, his, she, herself, her, hers, it, itself, its, they, their, them, themselves, theirs, this, these, that, those |
|
Query commands |
sorted, sort by, direction, group, group by, by, show, list, display, give me, name, just, only, arrange, rank, compare, to, with, against, alphabetically, ascending, descending, order |
|
Range |
greater, more, larger, above, over, >, less, smaller, fewer, below, under, <, at least, no less than, >=, at most, no more than, <=, in, between, in the range of, from, later, earlier, sooner, after, on, at, later than, after, since, starting with, starting from, ending with |
|
Times |
am, pm, o'clock, noon, midnight, hour, minute, second, hh:mm:ss |
|
Top N |
(order, ranking): top, bottom, highest, lowest, first, last, next, earliest, newest, oldest, latest, most recent, next |
|
Visual types |
as a table, as a bar graph, as a pie graph |
|
Wh (relationship, qualified) |
when, where, which, who, whom, how many, how much, how many times, how often, how frequently, amount, number, quantity, how long, what |
Last updated: 04 March 2026.


 AU
AU 