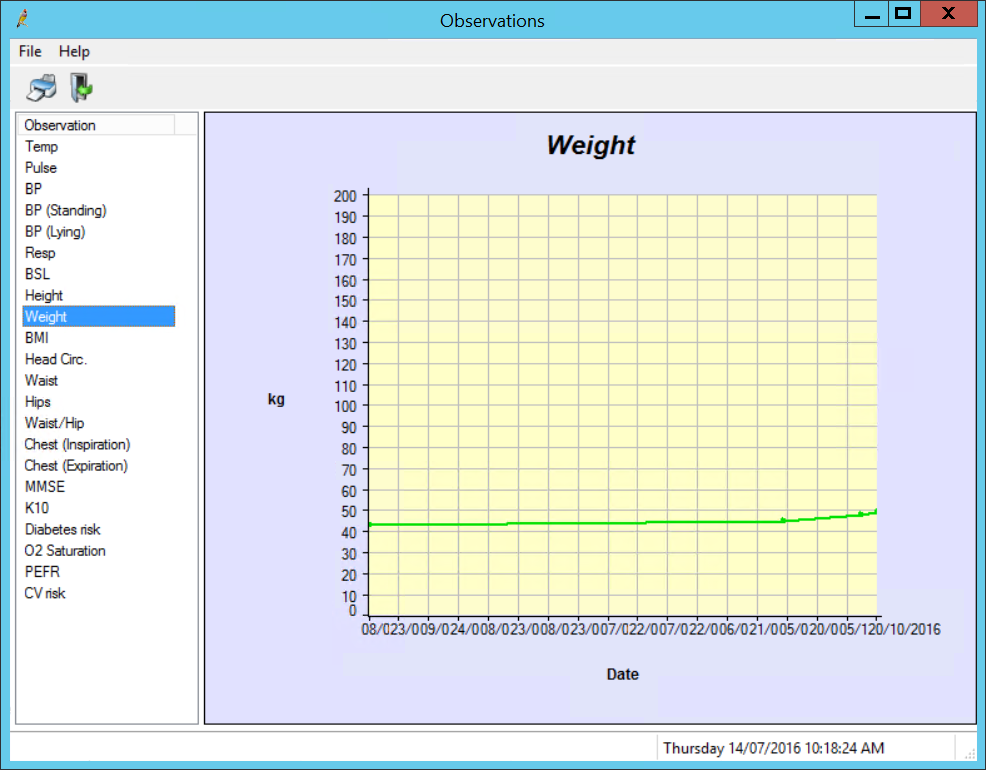
A provider can view and print graphs of observation values from the patient record. You can also graph atomised values from investigation reports, if the report data can be converted into a graph.
Print a graph of observation data
- Open the patient record.
- Selection Observations from the left hand tree.
- Click the Graph button above the table of observation data. The Observations screen will appear.
- Select the value from the left hand side that you want to observe. For example, a patient's change in height or weight over time.
- To print the graph, select File > Print or click the printer icon in the toolbar . By default, the graph printout will be sent to the printer configured for 'White paper (except letters)' in your printer settings.

Print a graph from an investigation report
- Open the patient record.
- Select Investigation reports from the left hand tree.
- Click Atomised values. The Atomised result values screen will appear.
- Click the graph icon in the toolbar, or select View > Graph to view a graph of the report data.
NOTE Percentile charts can be used to chart the growth of patients aged 0 - 20 against typical growth for their age. See Available clinical functions for more information.
Related topics
Last updated: 23 July 2020