You can create your own report in SQL Server Report Builder to suit your practice's reporting needs.
Users will need the Report Builder access permission set to 'Enabled' to create reports in Report Builder.
Building a report involves the following steps:
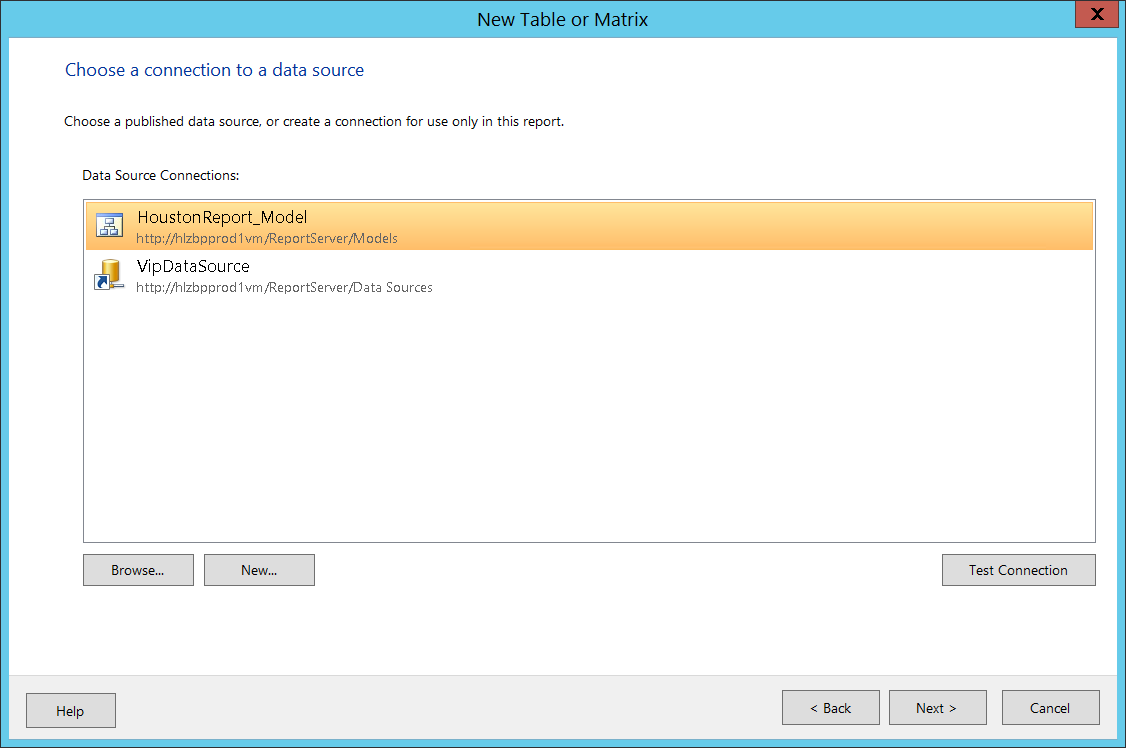
- Select a data source (usually the Houston report model).
- Select the fields to go in the report.
- Apply conditional filters to the report.
- Arrange how the fields will be displayed in the report.
- Finalise the style of the report.
NOTE The following instructions describe how to create a basic report. For more information on using SQL Server Report Builder to create more sophisticated reports., consult the user documentation for your version of SQL Server or click Help from any Report Builder screen.
Create a new report
The following example describes how to create a report showing the full name and date of birth for all patients at your practice over 90 years of age.
- From Bp VIP.net, select Reports > Report Builder. The Manage Reports screen will open, showing any custom reports already created.
- Click the Report Server link in blue at the top of the screen.
- The computer's default Internet browser will open at SQL Server Report Manager Home.
- Click Report Builder from the toolbar. Report Builder will open at the Getting Started screen.
- Click Table or Matrix Wizard. The New Table or Matrix screen will appear.
- Select the option Create a dataset at the bottom and click Next.
- If the model Connection HoustonReport_Model is not available in the Data Source Connections list, click Browse... and select Models > HoustonReport_Model to add the model.
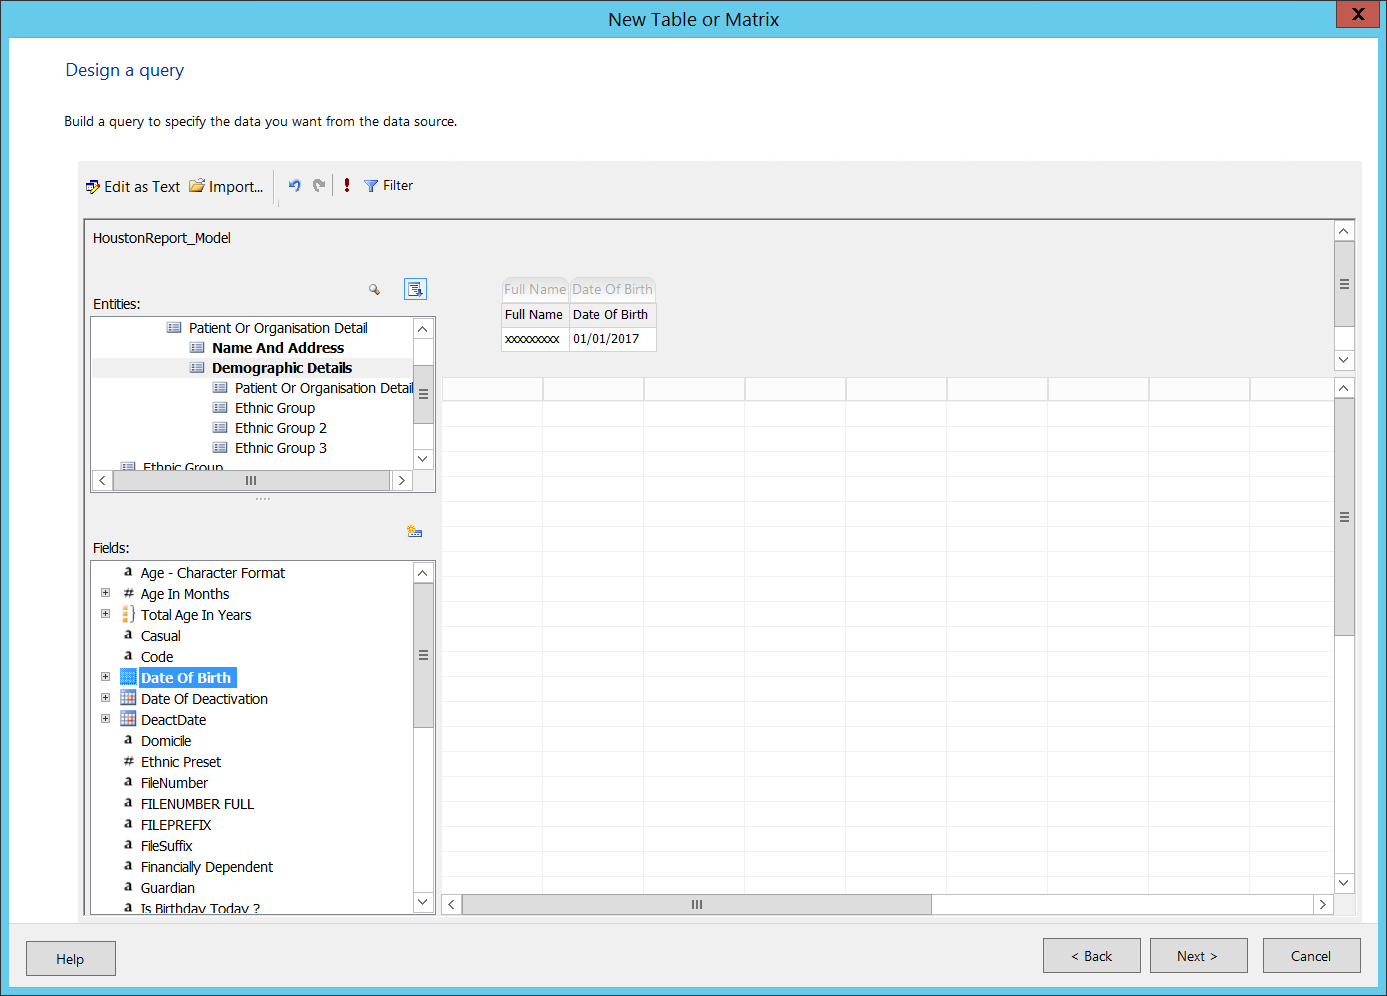
- Select HoustonReport_Model and click Next. The Design a query screen will open. This screen contains:
- Toolbar along the top
- A list of database Entities to select from.
- A list of Fields in a selected entity than can be included in the report.
- A row of selected fields beneath the toolbar.
- In the Entities list, select Patient or Organisation Detail > Name and Address.
- In the Fields list, scroll down and double-click Full Name. The field will be added to the row of selected fields.
- In the Entities list, select Patient or Organisation Detail > Demographic Details.
- In the Fields list, double-click Date of Birth. The field will be added to the row of selected fields.
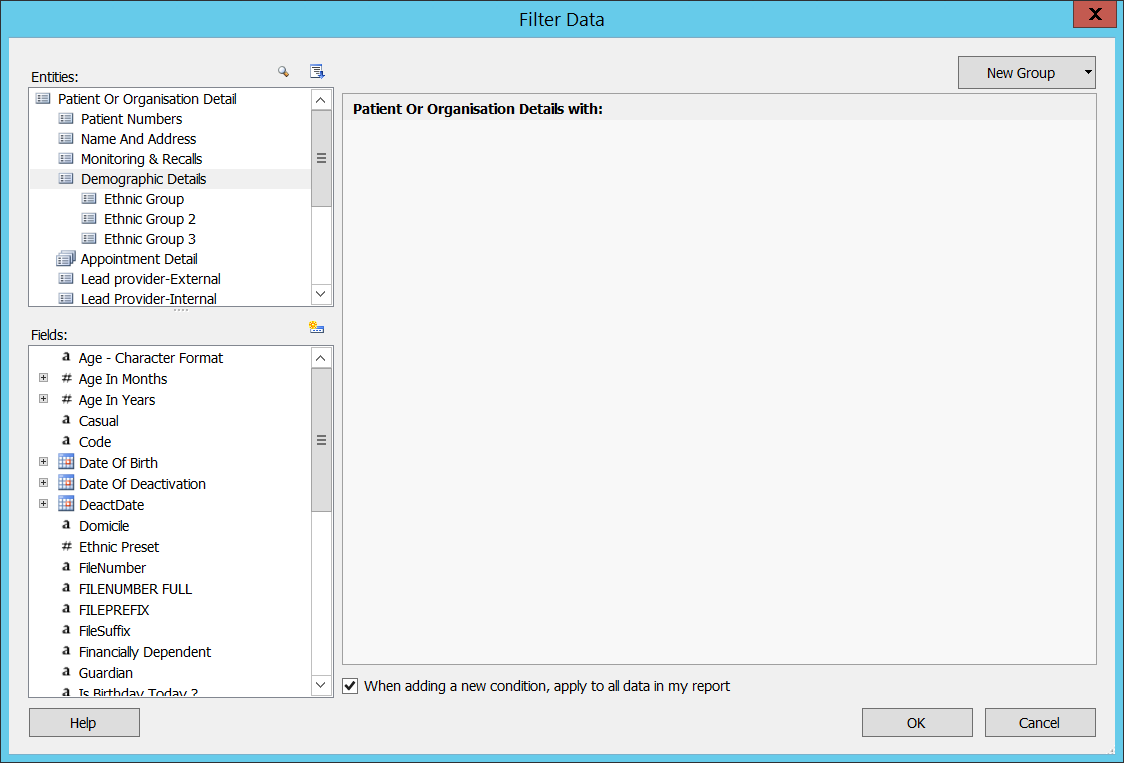
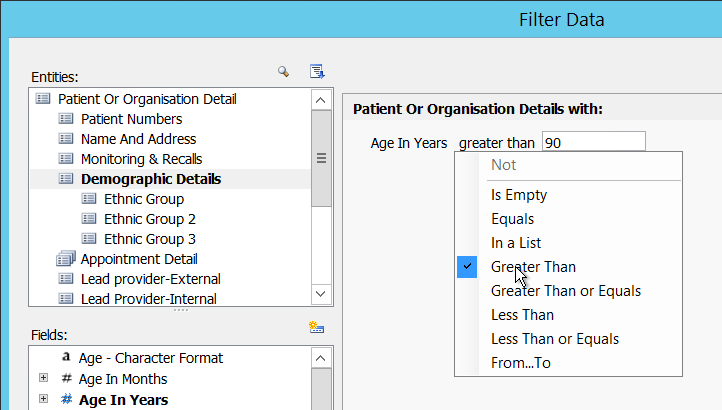
- Click the Filter icon in the toolbar.
- The Filter Data screen appears.
- In the Entities list, select Patient or Organisation Detail > Demographic Details.
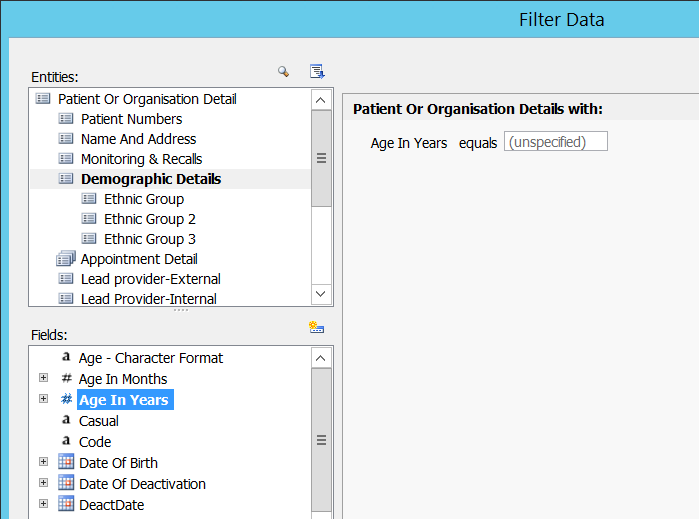
- In the Fields list, scroll down and double-click Age in Years. The field will be added to the list of filters on the right hand side.
- Enter '90' in the text field of the filter.
- Click the filter condition ('equals' by default) and click Greater than from the list.
- Click OK to save the filter.
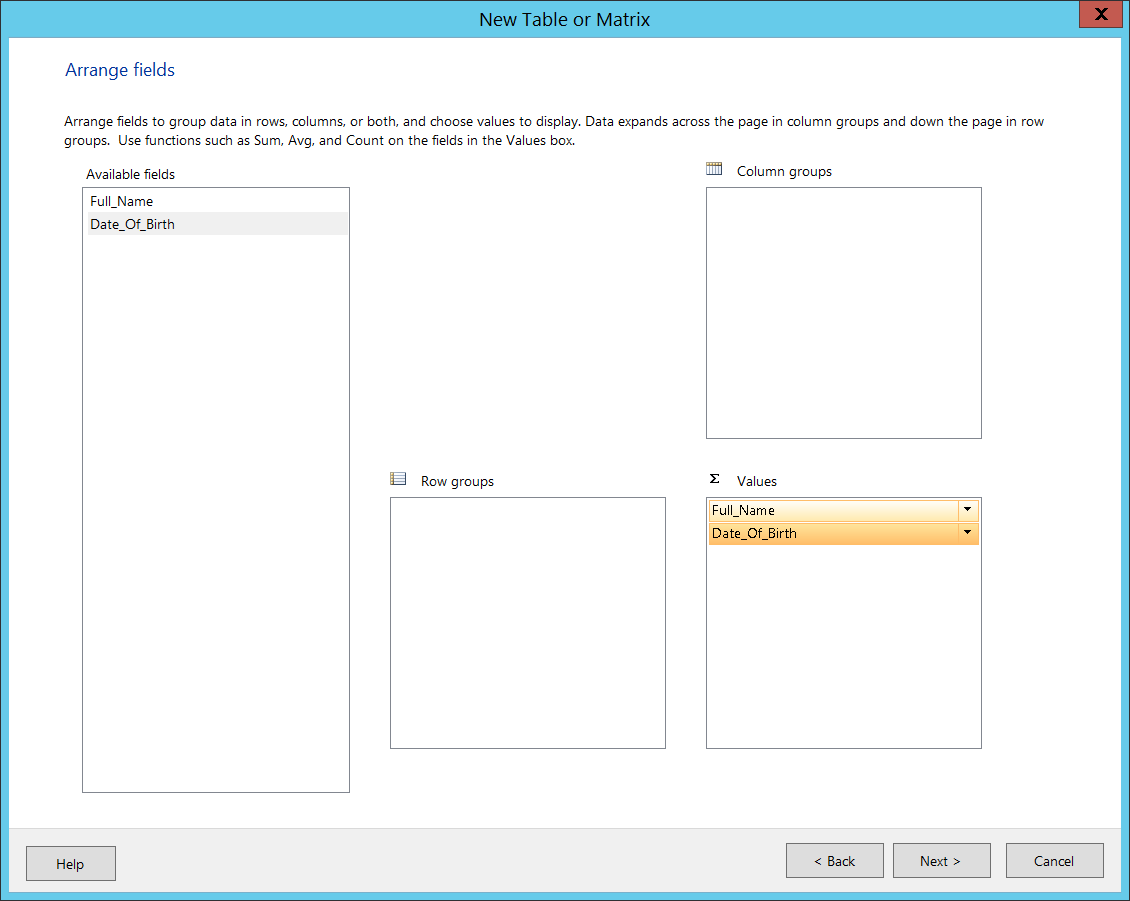
- In the Design a query screen, click Next. The Arrange fields screen will appear.
- Click and drag fields from the Available fields list to the other boxes in this screen to structure your report:
- Row groups — Combine fields into an expandable row
- Column groups — Combine fields into an expandable column
- Σ Values — Apply an operation to a field, such as summing all field values into a total, showing the most recent or highest value of a field, or counting the number of occurences.
- In the example screen above, the Full_Name and Date_of_Birth fields have been dragged to the Σ Values list.
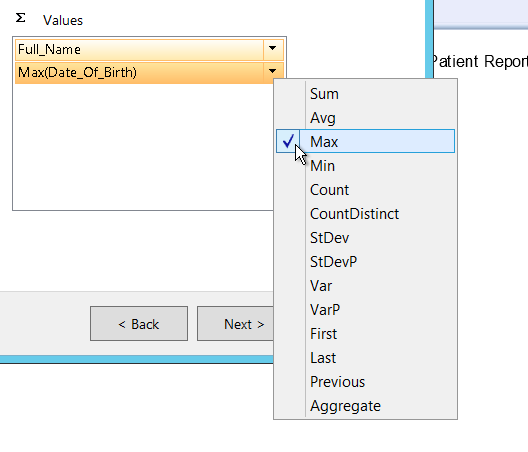
- To apply an operation to a field, click the down arrow to the right and select an operation from the list. In the example below, the Max operator is being applied to the Date of Birth field, which will show the highest or most recent date of birth.
- For a complete description of all of the operators available, consult the documentation for your version of SQL Server or click Help from this screen.
- Click Next. The Choose the layout screen appears.
- If your report has totals or subtotals, you can choose where to place total rows in relation to regular rows, and whether row and column groups are expanded by default.
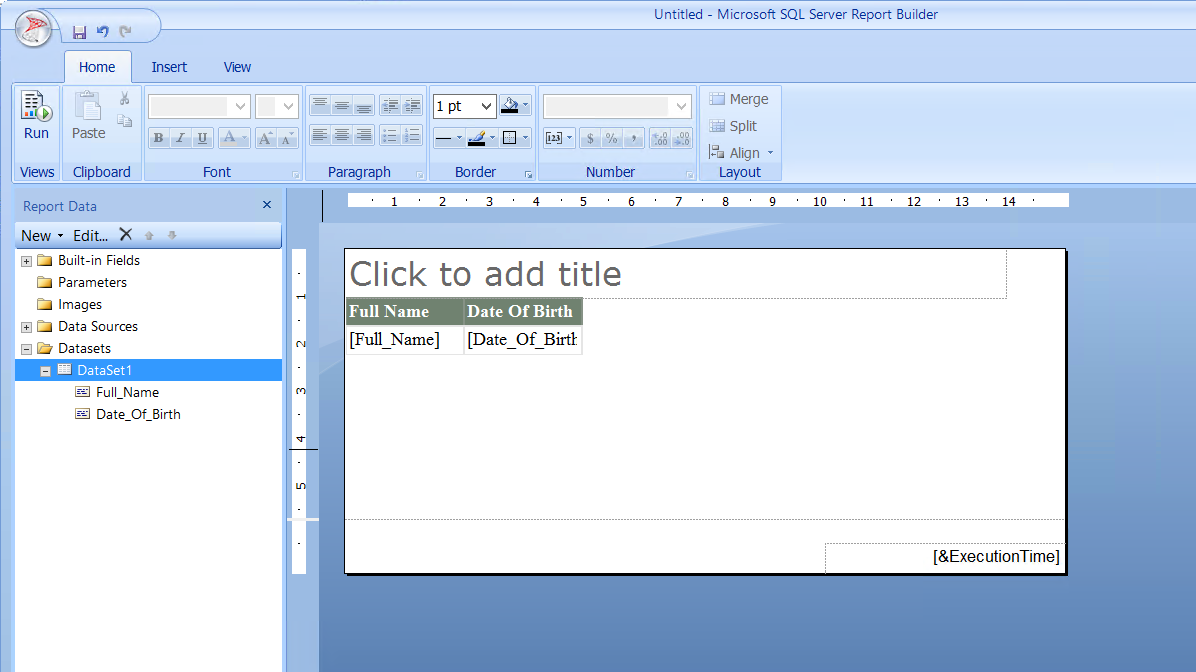
- Click Next. The Choose a style screen appears. Choose a theme for the report and click Finish>> to return to Report Builder.
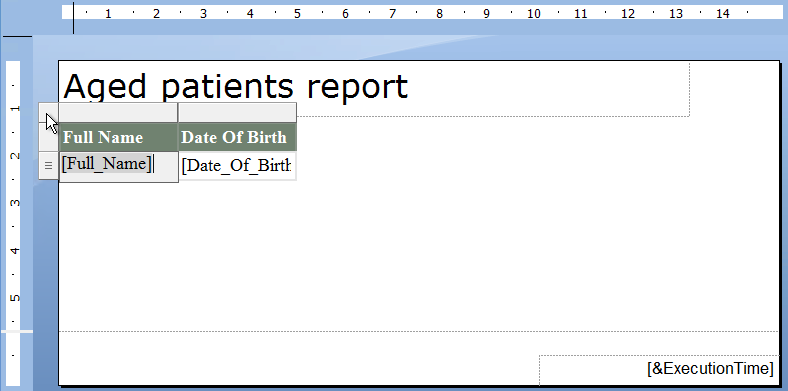
- Click in the text 'Click to add title' and enter a meaningful title for the report.
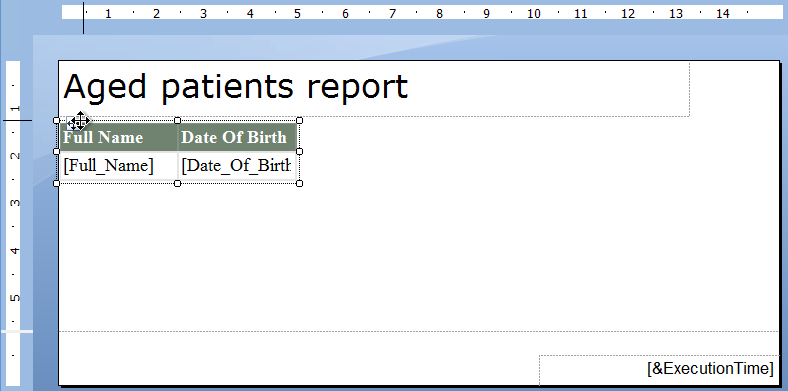
- To move the table of fields, click anywhere in the table to bring up the table headers.
- Click the tile in the right corner of the table to change it to the click and drag icon. Click the icon and drag to move the table.
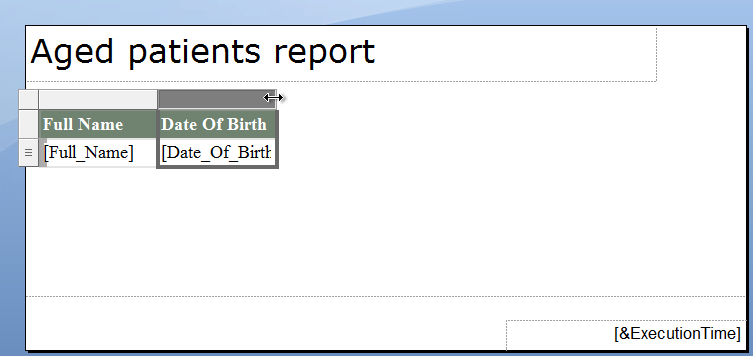
- To change the width of a column, click and drag on the sides of the header tiles.
- To run the report, click Run at the left end of the toolbar. Report Builder will process and display the report.
- Click Design to return to design mode and continue editing the report.
- Click the Save icon
 in the top left of Report Builder to save the report. Report Builder will prompt for path and filename.


Select data source
Select database fields
In the example above, the Full Name and Date of Birth database fields have already been added.
Apply filters

Arrange fields
IMPORTANT For your selected fields to appear in the report, you must click and drag all fields from the Available fields list to the Σ Values list, even if you are not applying totalling operators to any fields.
Style the report
Modify an existing report
- From Bp VIP.net, select Reports > Report Builder > Report Server link. The SQL Server Report Manager Home page will open.
- If you recently created a report but it does not appear in the home page, refresh the page in your browser.
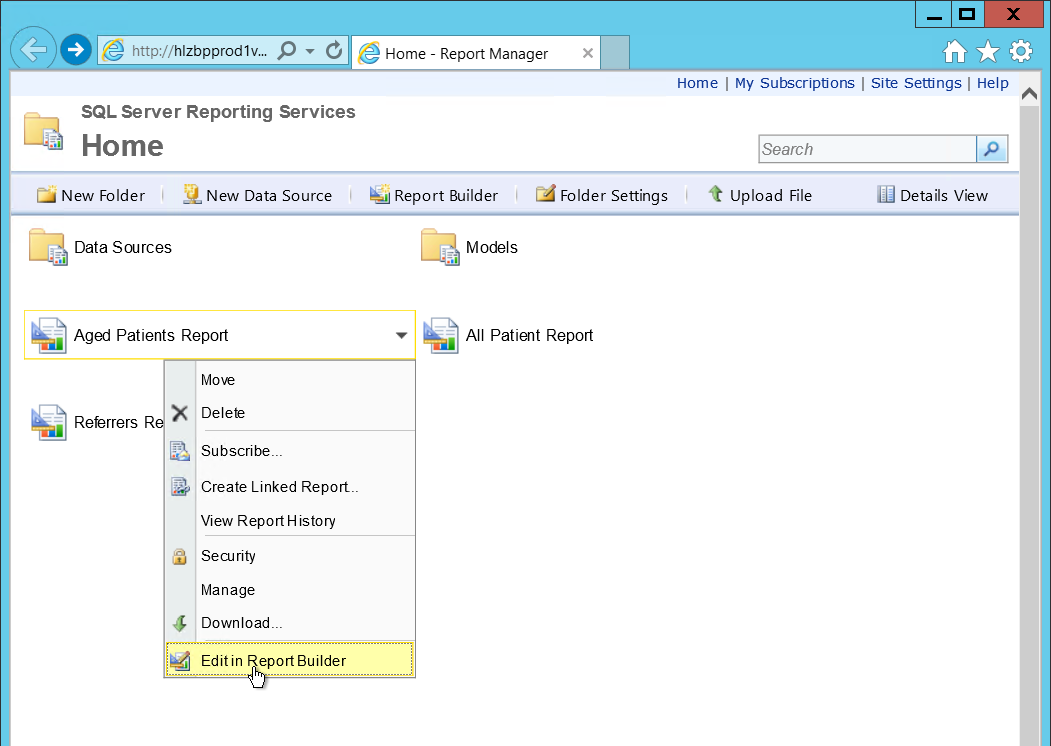
- Hover the mouse over a report name to show a down arrow. Click the arrow to see a list of options.
- Select Edit in Report Builder. The report will open in Report Builder in Design mode.
Add columns to an existing report
- Open the report in Report Builder.
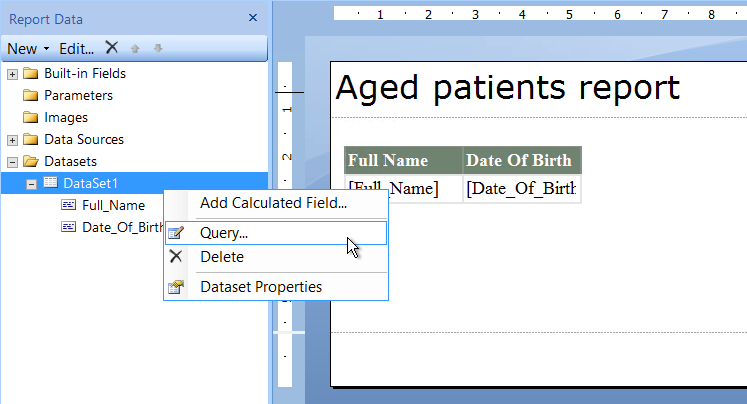
- Open the Datasets folder on the left hand side, and open the folder underneath. The fields you added in the new report wizard will be listed.
- Right-click the dataset and select Query.
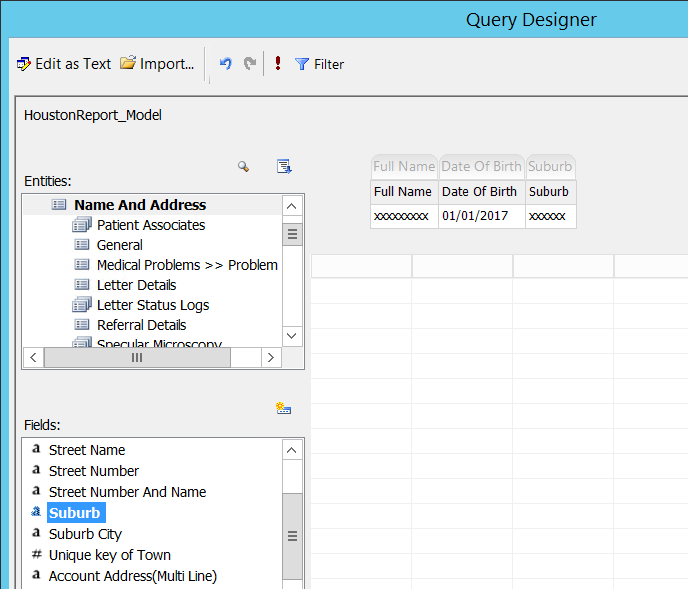
- The Query Designer will appear. Add a field as described in Select database fields. In the example below, the field Suburb has been added from Patient or Organisation Detail > Name and Address.
- Add as many fields as the report requires. Click OK to return to the Report Builder.
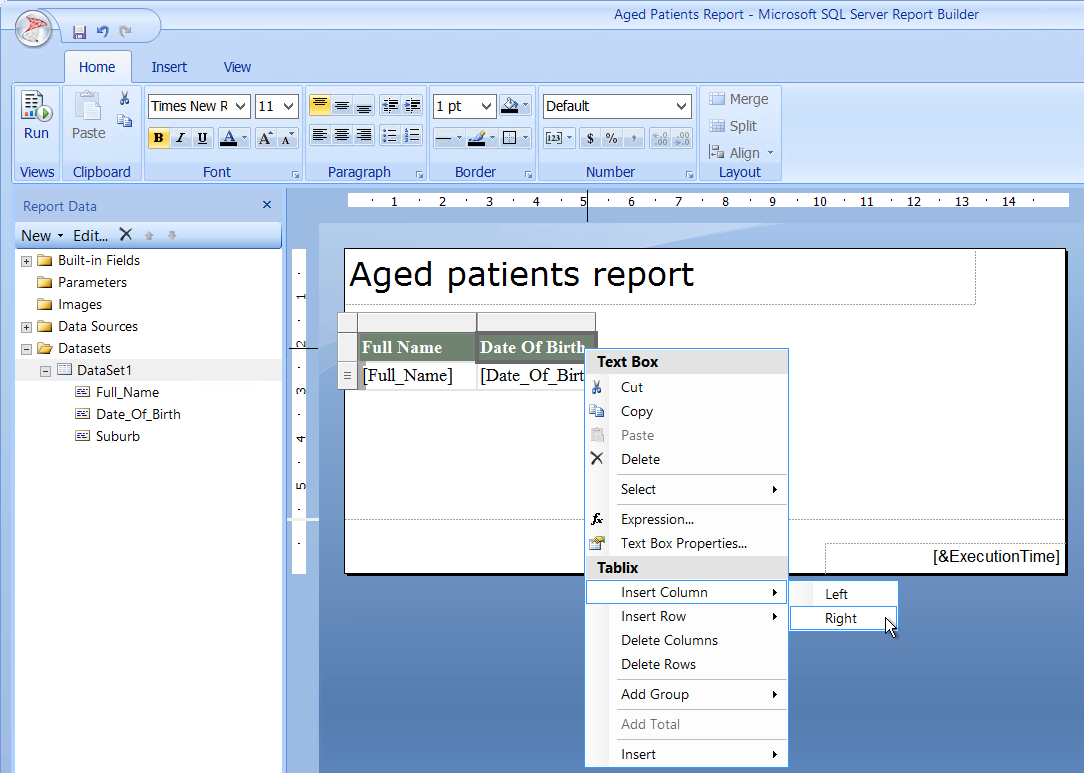
- Right-click a column in the report and select to Insert Column to the left or right. You can insert a new column anywhere in the table of fields.
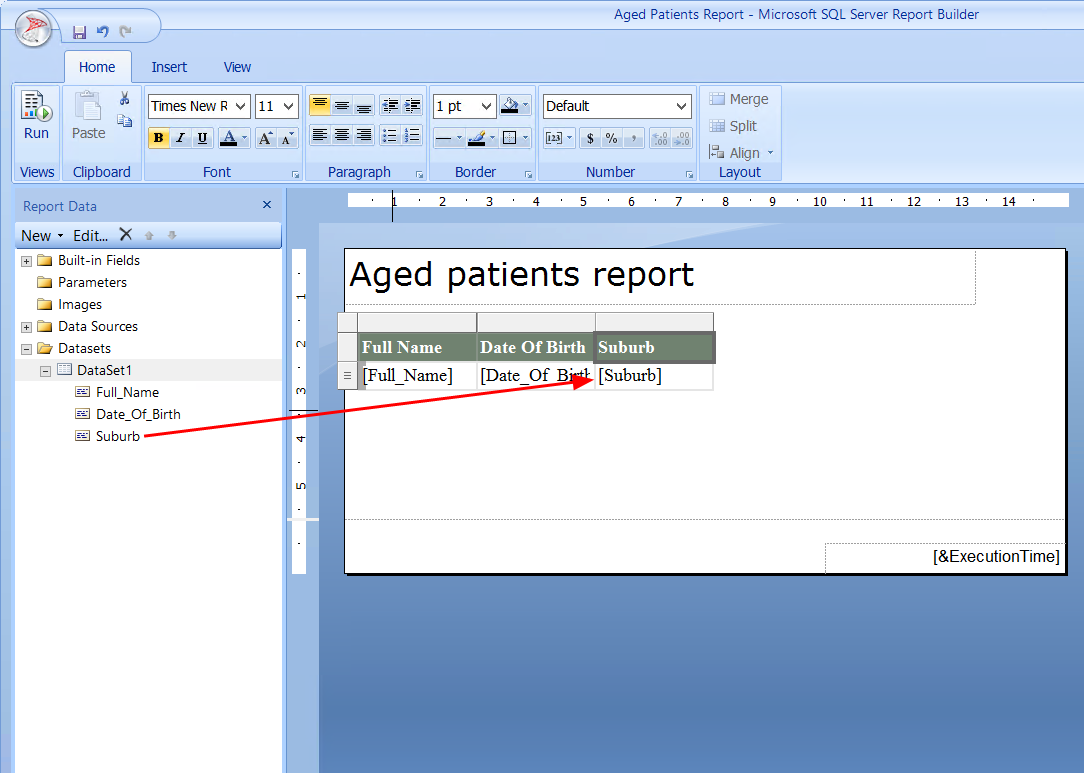
- Drag the new field from the Dataset list to the empty column you just created. The field will populate the column.
- Repeat for all new fields.
- Click the save icon in the top left to save the modified report.
The fields have been added to the dataset, but not yet added to the report.
Format fields
You may want to change the appearance or formatting of a field. For example, to convert from an American date format to an Australian format, or to impose two decimal places for dollar amounts.
- Open the report in Report Builder.
- Right-click the column you want to modify and select Text Box Properties.
- The Text Box Properties screen will appear.
- To modify the decimal settings for a dollar value, select 'Currency' from the Category list and set currency formatting such as the number of decimal places and regional dollar symbol.
- Click OK to save the formatting.
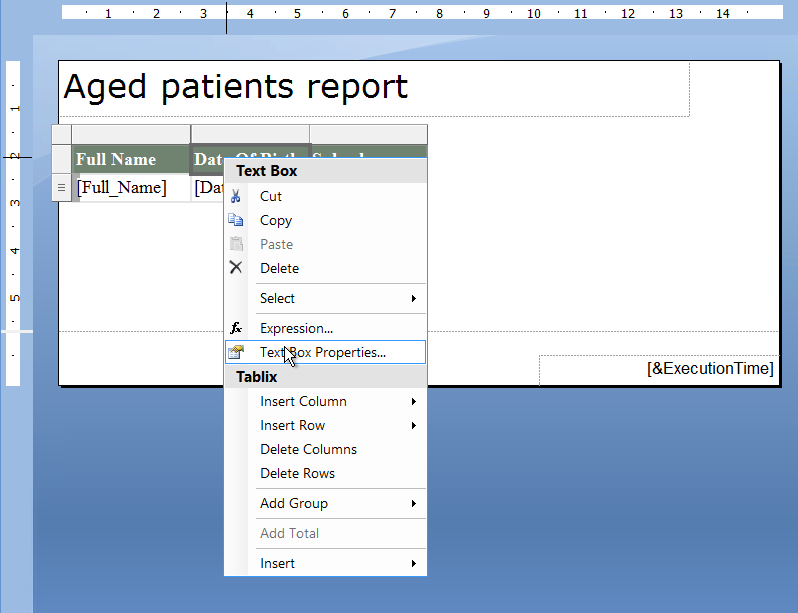
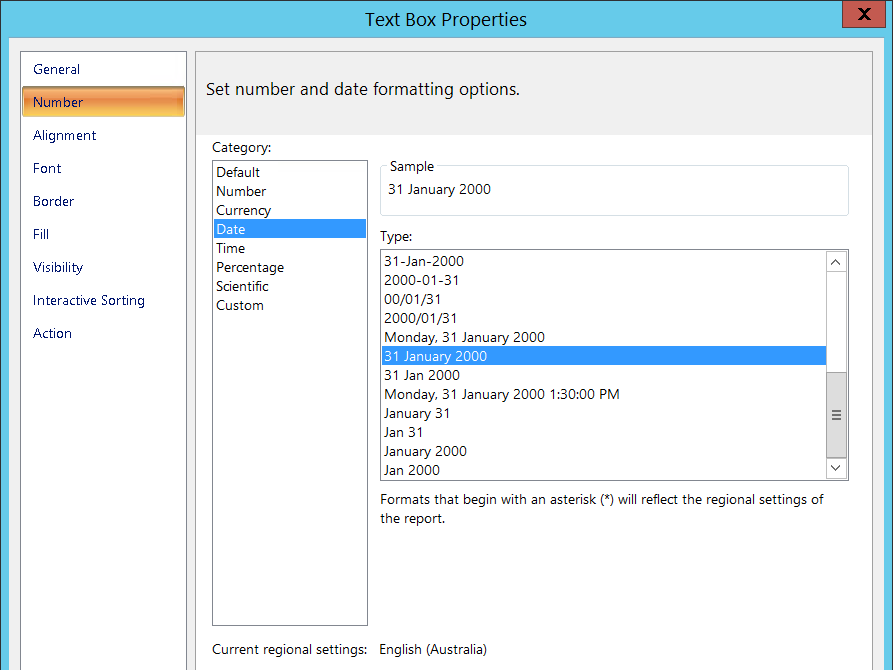
In this example, we are applying a date format in the style '31 January 2000' to the patient's birthday field.
Add report parameters
Parameters act in a similar manner to filters (they change the data that is displayed in the final report), but are applied after all the report data has been retrieved. Parameters can be specified at runtime by the user from the report viewer.
For example, you may wish to add a parameter 'Age' so that a user can enter the age to filter the report by, instead of being hardcoded to 90 years or older.
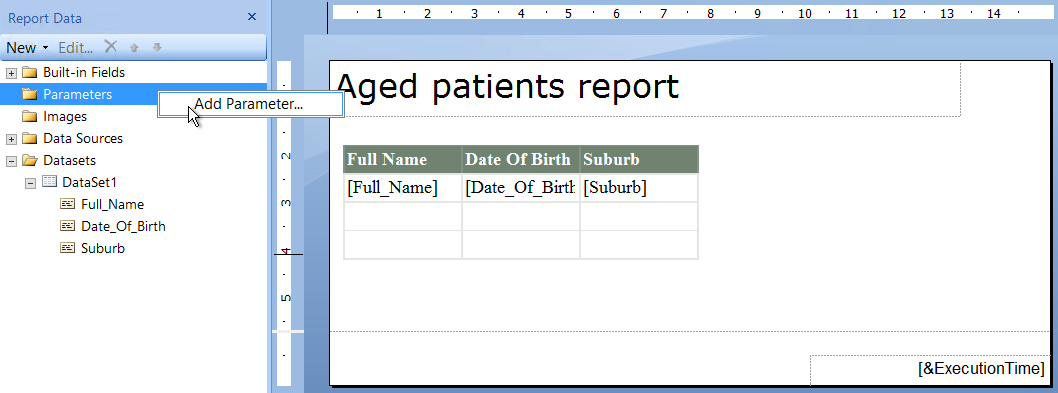
- From the Report Builder screen, right-click Parameters and click Add Parameter.
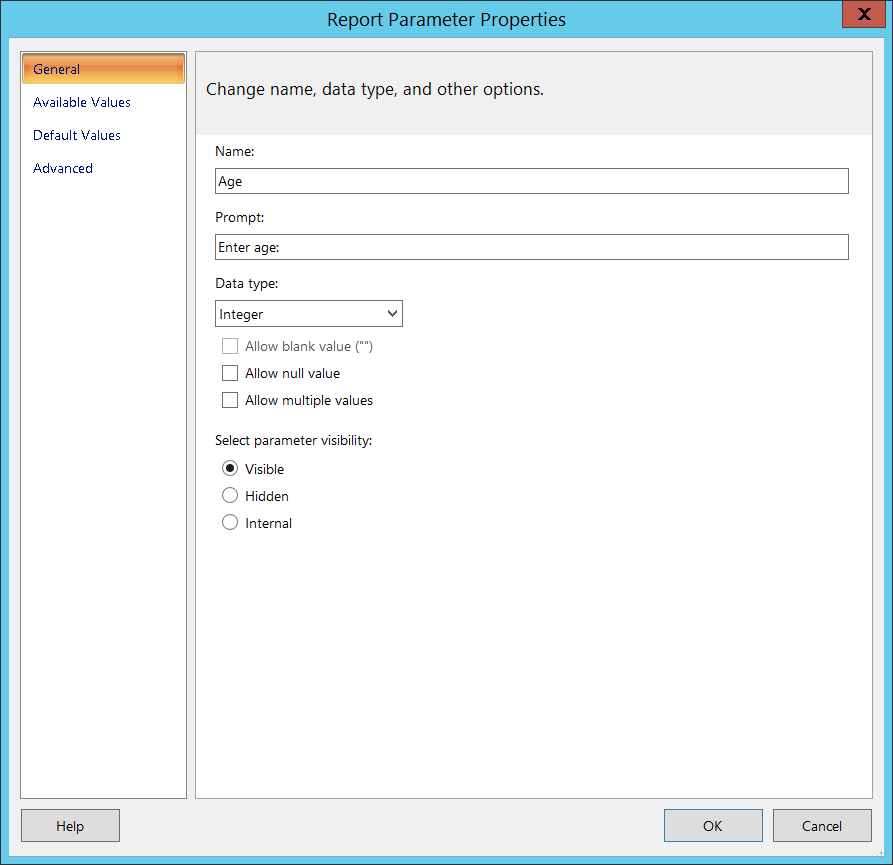
- The Report Parameter Properties screen will appear.
- Enter a descriptive Name and Prompt. The Prompt field is displayed in the report viewer, where the user enters or selects a value to filter the report.
- Select the Data type of the parameter. The data type will depend on the field you are filtering on. For example, it makes no sense to compare a parameter of type 'Date/Time' to the Age in Years field, which is an integer.
- Set the parameter visibility. Refer to the Report Builder user documentation for more information on how this field affects your report.
- Specify the Available Values and Default Values for the parameter by selecting the tab on the left. For example, you can restrict the user to selecting a value between '50' and '100' years of age, and set the default value to '90'.
- Click OK to save the parameter and return to the Report Builder screen. The parameter will be added to the Parameters list on the left hand side of the Report Builder.
- To edit a parameter, right-click and select Parameter Properties.
- You can now use the parameter value in other calculations in your report. For more information on including parameters in queries and report design, search the Report Builder Help documentation.
Apply Grouping to rows and columns
You can group rows and column to organise the data in your report and provide 'total' rows.
- From the Report Builder screen, click the down arrow in the blank group field in Row Groups or Column Groups at the bottom of the screen. You can create grouping hierarchies of parents and children for complex reports.
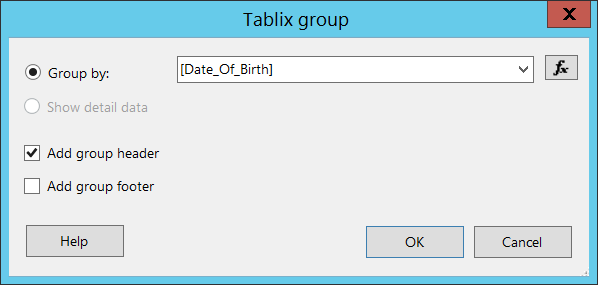
- The Tablix group screen will appear. Select the row that you want to group, and add a group header to the report.
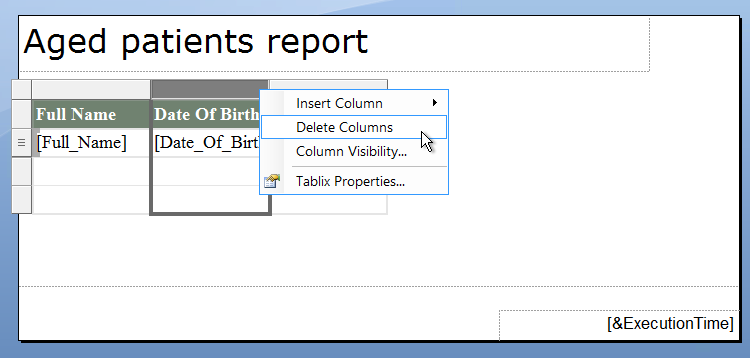
- If you want to delete the original row that is now grouped, right-click on the column header in the report design space and select Delete Columns.
- To add a total row, click the down arrow again and select Add total and place the total row before or after the grouped rows.
- Save the changes and run the report to view how your report looks.

Last modified: July 2020
