The Financial Summary is a detailed report of all billings created and payments received within a date range.
You can apply filters to report on subsets of the total billing data for that period. For example, you can report on selected providers only, or selected insurers, or batched payments with a specific status. Data in the report can be broken down into meaningful totals and subtotals. For example, you could include all revenue accounts in the report, but break down totals by revenue account and then by provider.
If you are seeking information on batching status, including declines, partial submissions, payments, and owing, review Batch Reports.
Service Date and System Date explained
Bp VIP.net transactions can be listed and reported on by system date or service date:
- The system date is the date of creation of the consult or transaction and cannot be changed.
- The service date is the date entered by the user when recording or modifying a transaction.
A user can forward or back-date an invoice or transaction by changing the Date field in the Consultation or Payment screens. Users are also able to modify the payment from the Transaction screen and change the service date again to another date.
Forward or back-dated transactions will display a caret next to the date value in the Transaction screen to indicate that the service date is different to the system date.
NOTE When running a report from the Financial Summary using the Service date, the time component of the To and From fields is removed for more accurate reporting results.
Run the financial summary
- Select Reports > Financial Summary from the menu. The report header will show all of the options you can use to create the report.
- Select the date range and the date type to search by (1).
- Apply filters to narrow the amount of data in the report (2).
- Select GST inclusion, which patients and organisations to report on, and apply any sorting and subtotal grouping (4).
- Select the view type for the report (6).
- Run the report (5).
- Save the report parameters so you can rerun the report, and export the report or print (3).

If you click and highlight a row, pressing F5, F6, or F8 will open the Consultation, Payment, or Transaction screen for the patient or organisation associated with the transaction in that row.
The sections below describe the report parameters and filtering options available. If you want to see the current filter selections, click the Filter Choices information icon under the Save buttons on the right hand side.
Save and load a report for a time period
To save a new Financial Summary report:
- Apply a date range, filters, sorting, and grouping.
- Run the report to view the results.
- If the report returns the data were you looking for, click Save As in the top right.
- Enter a Saved Report Name and click OK.
To run a saved report, select the report from the drop-down in the top right and click Run Report.
To delete a saved report, select the report and click Delete. Bp VIP.net will delete the saved report without prompting.
Select a report period
The To date is inclusive in the report period.
You can report on sub-day periods in the financial summary, for practices who bank twice or more a day, or need visibility into different staff shift times. The Date/time report period in the top left includes a HH:MM:SS time component (using 24H format) that defaults to midnight of the starting day, but can be manually edited. For example, to report on a period of 8am to 12am on a day, you would set the times to:
From: 16/07/2018 08:00:00
To: 16/07/2018 12:00:00
Apply a filter
The top row of buttons on the Financial Summary header filter the data shown in the final report.
- Click a filter button. A Select screen will open.
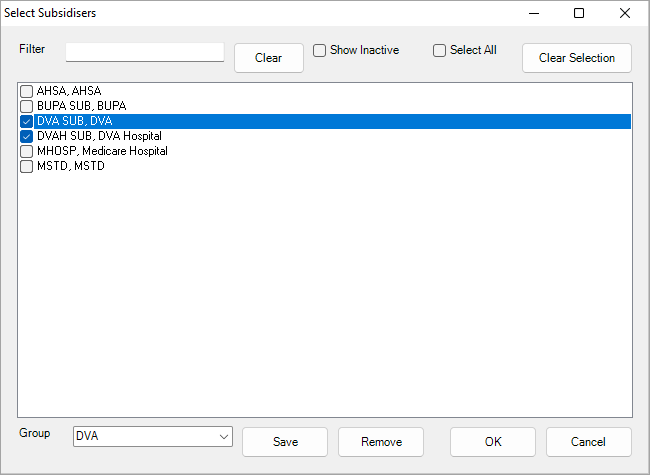
- Start typing in the Filter field to limit the options to those matching the filter text. Options already selected will remain.
- Tick Show Inactive to include options that have been defined in Bp VIP.net but marked as 'Inactive'.
- Click OK to apply the filter. The filter button text will turn red to indicate a filter has been applied.

TIP You can save a selection as a group and apply the selection when running another report later. Select the options that apply and type a name for the selection into the Group field. Click Save to save the group. To remove a group, select the group and click Remove.
The available filters are:
|
Filter button |
Description |
|---|---|
|
Redirected Organisations |
Report only on consultations redirected to the selected organisations (for example, an insurer). |
|
Feescalers and Insurers |
Report only on the selected fee scaler for the consultation (as specified in the Consultation screen (F5)). For Bp VIP.net AU, you can report on selected Daystay insurers only . |
|
Revenues |
Report only on billings and payments against the selected revenue accounts. |
|
Providers |
Report only on consultations associated with the selected providers. You can include inactive providers. |
|
Locations |
Report only on providers who are bookable at the selected locations. |
|
Workstations |
Report only on transactions created from the selected Bp VIP.net workstations. This filter can assist in pre-banking and troubleshooting if you need to locate the operator or workstation source for a transaction. |
|
Pay Types |
Report on transactions of the selected pay types only. |
|
Subsidisers |
Report only on consultations associated with the selected subsidisers. Subsidisers are often combined with the Batch Status filter, for example, to report on resubmitted ACC batches only, or unsent insurer batches. |
|
Users |
Report only on billings and payments recorded by the selected users logged in from any workstation. |
|
Items |
Report only on billing and payments involving the selected consultation or stock items. All items in Setup > Charges or Setup > Stock are available for selection, including prostheses. |
|
Categories |
Report only on the selected item categories. When you create a chargeable item, you can assign the item to a category for reporting purposes. |
|
Materials |
Report only on the selected materials items (from Setup > Charges > Materials). |
|
Match Item Categories |
Considers chargeable items assigned to a category in the report's date range to have always been in that category. For example, say that a chargeable item code for crutches was originally assigned to the item category 'General'. However, after six months the items codes are reviewed and now crutches are assigned to the category 'Mobility'. If Match Item Categories is ticked, crutches will always be considered to be part of the category 'Mobility', even for purchases made when they were assigned the category 'General'. |
|
Daystay |
For Bp VIP.net AU customers who use the Daystay module. Select to include or exclude daystay-related financials from clinical financials. |
NOTE You can now run batch status reports by using the Groups filter. See Batch Reports for more information.
Select GST and patient/organsiations
The options along the bottom of the report header determine GST and patient or organisation inclusion:
|
Option |
Description |
|---|---|
|
GST |
Determines whether rows show amounts inclusive of GST or exclusive of GST, and whether the GST component is shown on a separate line. Selecting an '... and GST' option can help identify that GST has been charged correctly.
|
|
Exclude non-GST |
This option is available if anything other than 'All' is selected for GST. Tick this option to show only items with a GST components in the report. Items with no GST component will not be shown. |
|
Patients/Organisations |
Include patients or organisations:
|
|
Deleted |
Include or exclude deleted transactions in the report:
NOTE If you select 'Include' or 'Only', totals in the report will not be correct. Reporting on deleted transactions can assist troubleshooting accounts. |
Split, group, and sort the report data
The Split By dropdown menus break down a report into one or two levels of subtotals.
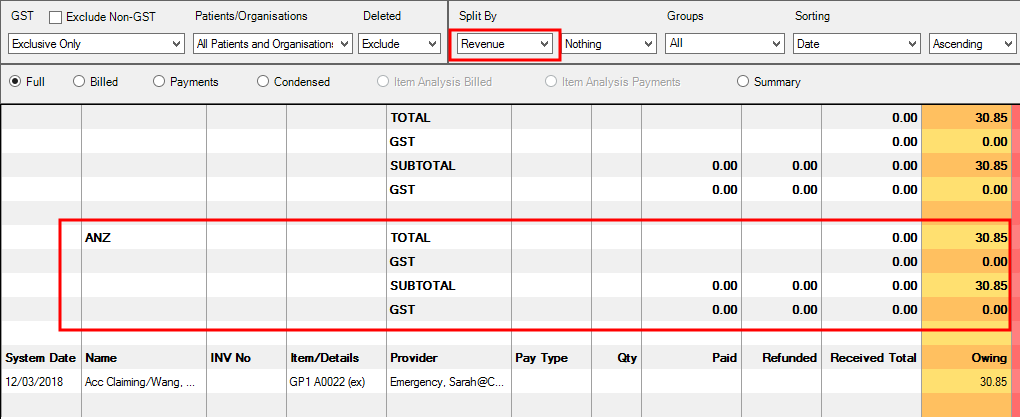
Example split by Revenue account
Say that you want to see totals for each revenue account. Select 'Revenue' from the first Split by option and run the report.
The report excerpt below shows 6 payments received. Under the first total and subtotal rows is the first revenue account (ANZ) and the totals for that revenue account (all 6 payments). The blue section of the report would show corresponding billed items for the practice and the revenue account.

Underneath the totals for ANZ is the list of patients that make up the payments for that revenue account. The next revenue account will appear after the patient rows, and so on.
Split by revenue account and provider
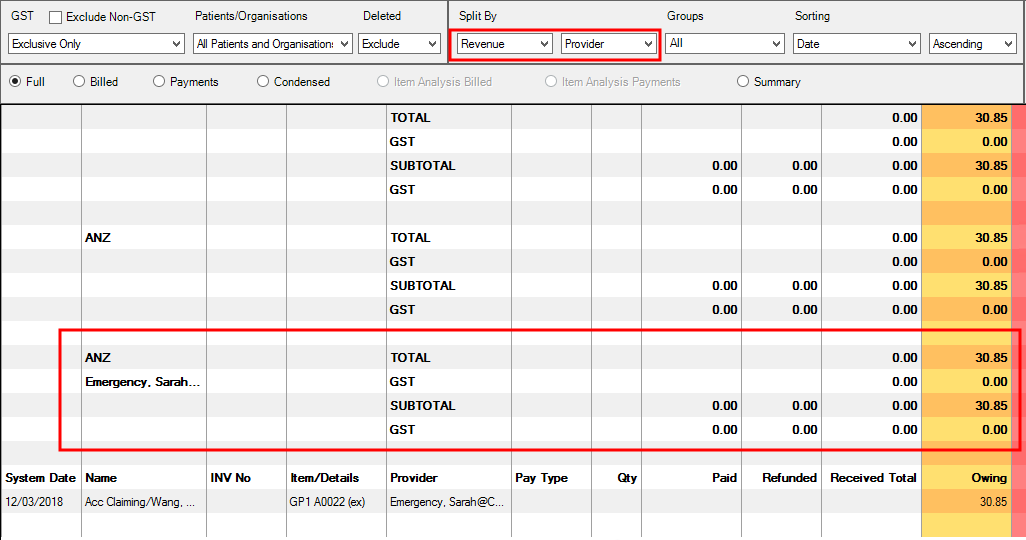
Say that within each revenue account, you wanted to break totals down by provider. Select 'Provider' from the second Split by option and run the report.
In the example below, the report period includes 6 payments received, and the revenue account totals appear underneath as in the first example. However, now there is another set of totals for the first provider (Harry Cardiology), who has 4 payments.

Underneath the Provider totals is the list of patients that make up the payments for that provider. The report will then show the totals for the next provider in that revenue account, and the list of patients that make up the totals for that provider.
Grouping a report
Grouping will total amounts based on the group selected.
For example, you could group by 'Item' to see totals by chargeable item.

Grouping by provider
There are two options for grouping by provider:
- Select 'Provider@unit' to show totals by provider at each attended location.
- Select 'Provider' to show totals for a single provider across all locations. This option is useful for summing totals when a single provider works at multiple locations.

NOTE If a provider has a provider@location record in Setup > Providers > This Clinic with a significantly different provider number, Bp VIP.net will be unable to include the provider in totals using the Groups filter. Such a provider will appear separately in Financial Summary reports grouped by provider. Bp VIP.net will alert the user viewing the report that the report will include totals for multiple providers.
You can combine selections from Split By and Groups. For example, if you split by 'Provider' and group by 'Item', the report will show totals for each provider, and under each provider, payments will be grouped by chargeable item.
Grouping by Journal Entry
Select 'Show Journal Entries' in Groups to show journal entries associated with modified consultations (similar to ticking Show Journal Entries in the Transaction screen (F8)). This grouping is best used for troubleshooting, because the final report can contain a large number of items.
Sorting a report
You can sort a report by a selected column. The options available in the Sorting dropdown menu depend on the Groups selection. Rows are sorted alphanumerically in ascending or descending order, based on the user selection.
Select a view type
Different views are available for the Financial Summary report, to suit what you are looking for and how your practice uses the Financial Summary.

|
View |
Description |
|---|---|
|
Full |
Shows all possible columns in the financial summary and all contributions to totals in each subsection (payments, adjustments, billings, subsidies, and redirections). |
|
Billed |
Shows all items charged during the selected date range. The billed report is affected by the blue, red, green, and yellow coloured sections of the Financial Summary. |
|
Payments |
Shows all money receipted and refunded during the selected date range. |
|
Condensed |
This is the new default report when using the financial summary. This report gives a quick overview of payments, adjustments, and billings within the selected date range. |
|
Item Analysis Billed |
Billed view broken down by item analysis. This option is only enabled if you select 'Item' from the Groups filter. |
|
Item Analysis Payments |
Payments view broken down by item analysis. This option is only enabled if you select 'Item' from the Groups filter. |
|
Summary |
Intended for VIP Gold customers who have migrated to Bp VIP.net. The summary view is not suitable for viewing online, and should be printed, emailed, or exported. |
See Reading the Financial Summary for more information.
Print, email, or export a report to Excel
Because the financial summary contains many columns and can span 2–3 A4 pages if printed, Bp VIP.net offers options to condense the report. Printing and export options appear at the bottom of the report.
- Select your filters, grouping, and sorting, and click Run Report.
- Click Print to print the report to the workstation's printer or email the report, or click Export to Excel. Bp VIP.net will prompt you for a filename and location to save the financial summary report in Excel format.
NOTE If the Run Report button text is red, this indicates that you have updated the report settings. You must rerun the report to see the latest changes before printing or exporting.
ABN, revenue GST
Related topics
Last modified: 13 October 2023
