
The Appointment Statistics reports shows the total number of appointments and appointment hours per provider per month, and the total number of appointments and appointment hours by type, per provider at your practice.
There are two appointment statistics reports available: combined locations and individual locations. The combined locations report provides overall totals for all locations whereas the individual locations report includes separate tables and totals per location.
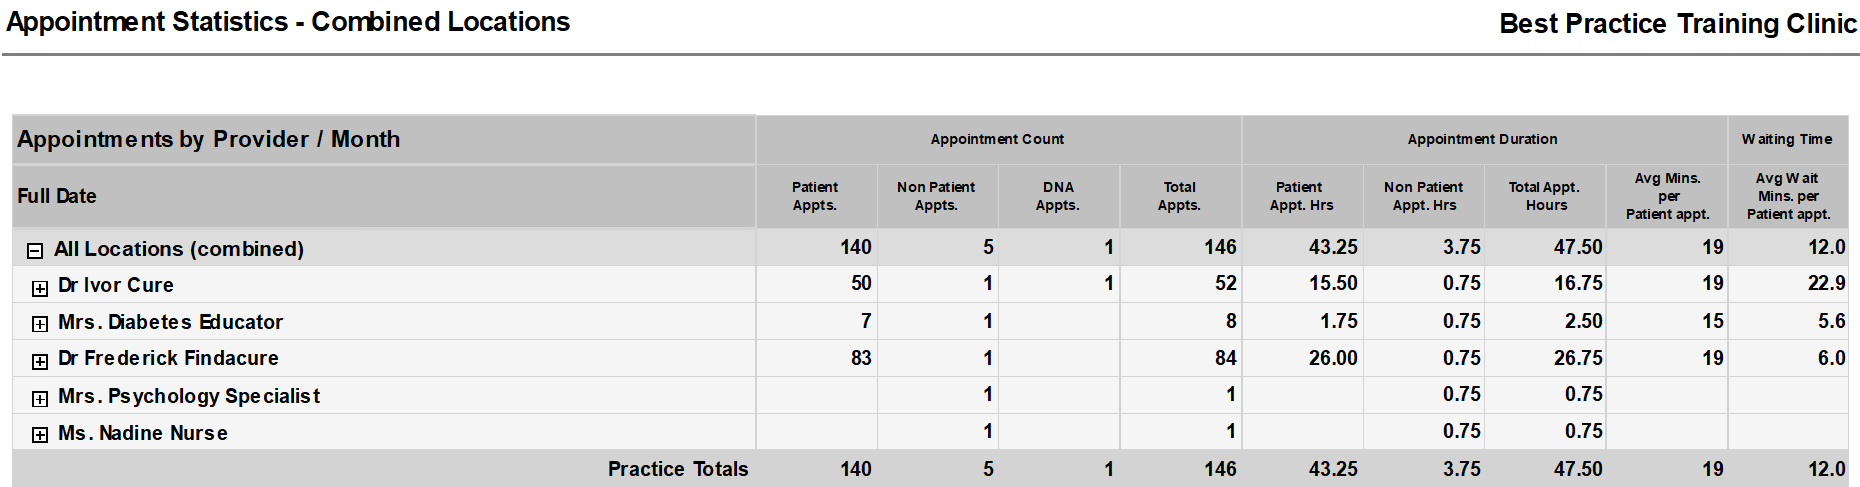
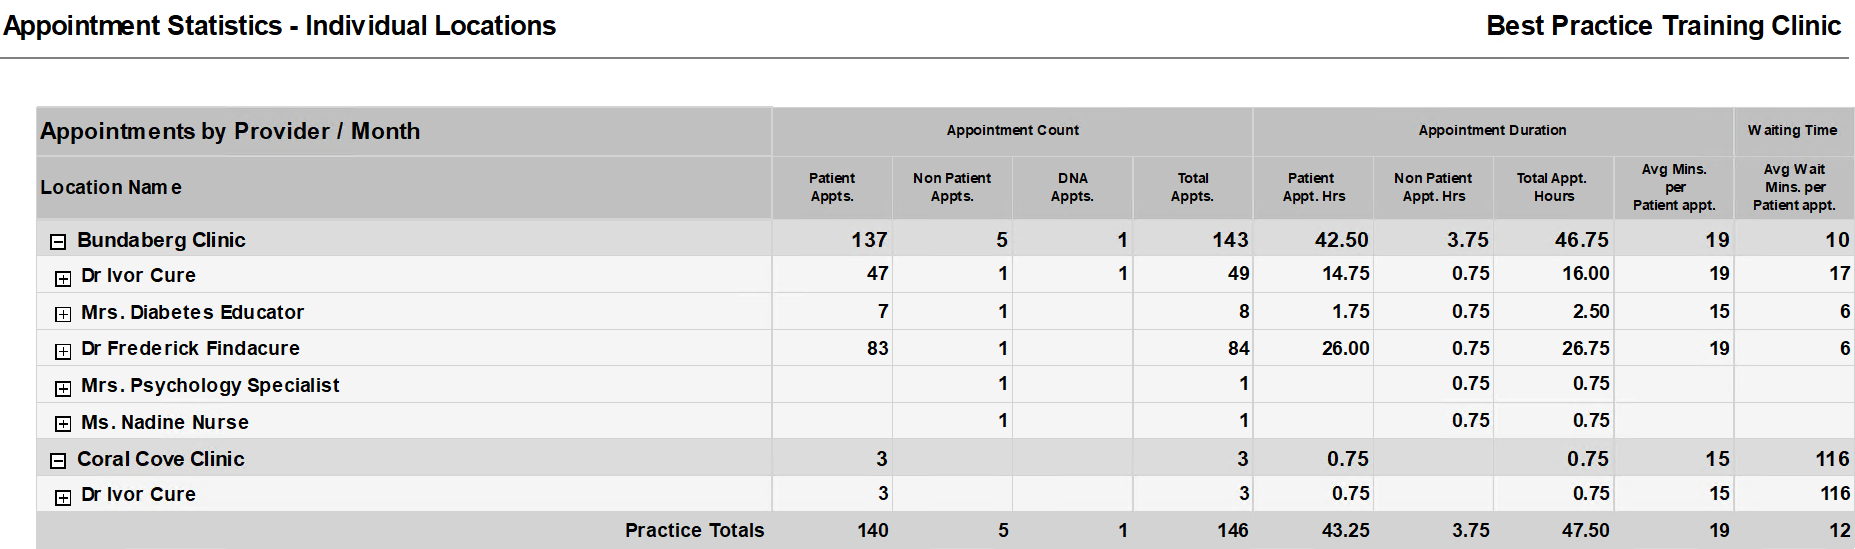
Appointments by Provider / Month
The Appointments by Provider / Month section of the Appointment Statistics reports shows the appointment count at your practice for each provider per month within a given date range. Depending on the report, the appointment count will be listed by location, or for combined locations.
The appointment count is broken down into patient appointments, non-patient appointments, did not attend (DNA) appointments, and the appointment total.
The report also lists appointment duration for patient and non-patient appointments, total appointment hours, average minutes per patient appointment and average wait time in minutes per patient appointment.
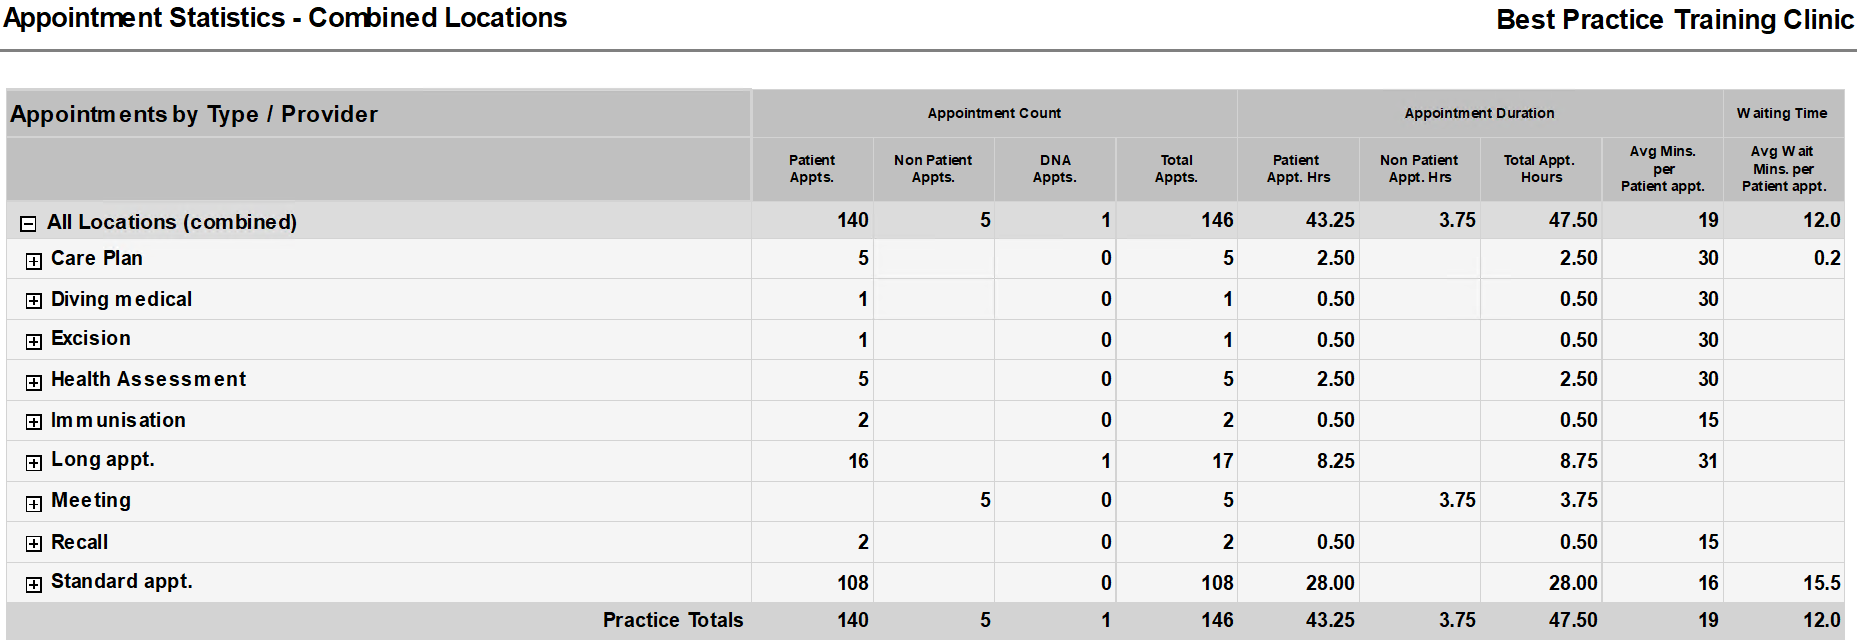
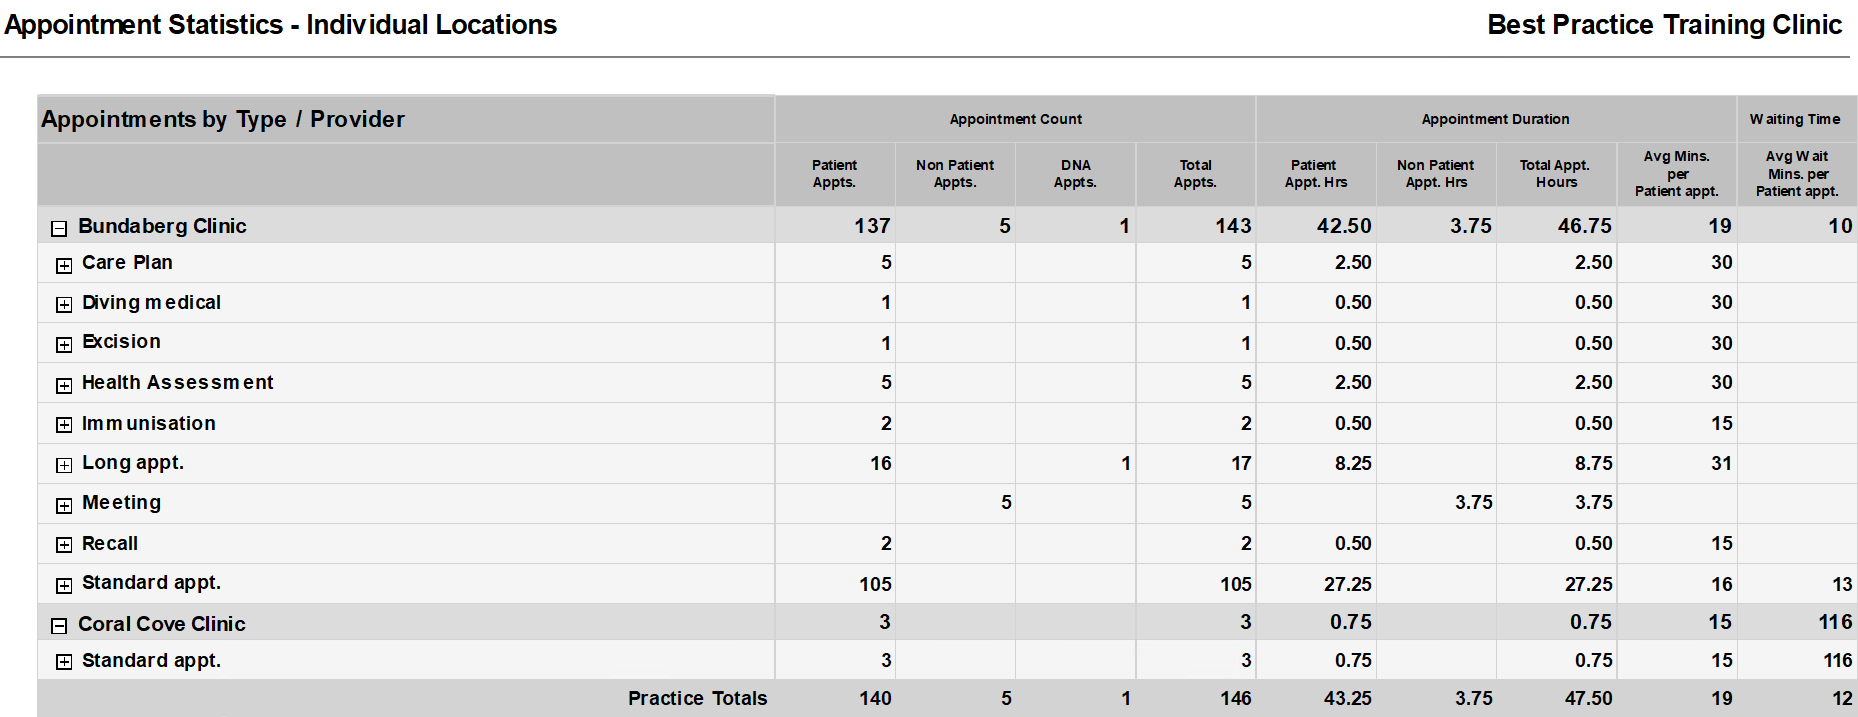
Appointments by Type / Provider
Appointments by Type / Provider shows the appointment count at your practice per appointment type, such as health assessment or telehealth consult, within a given date range. Depending on the report, the appointment count will be listed by location, or for combined locations.
The appointment count is broken down into patient appointments, non-patient appointment, did not attend (DNA) appointments, and the appointment total.
The report also lists appointment duration for patient and non-patient appointments, total appointment hours, average minutes per patient appointment and average wait time in minutes per patient appointment.
Graphs
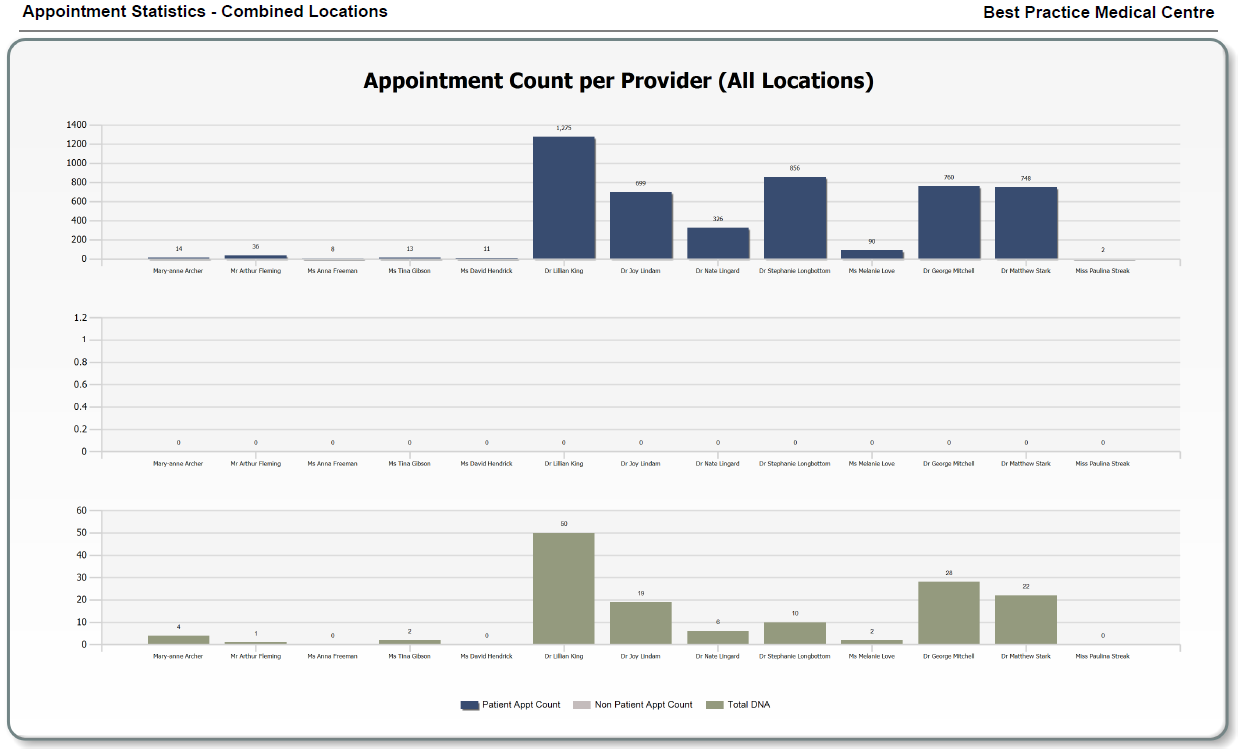
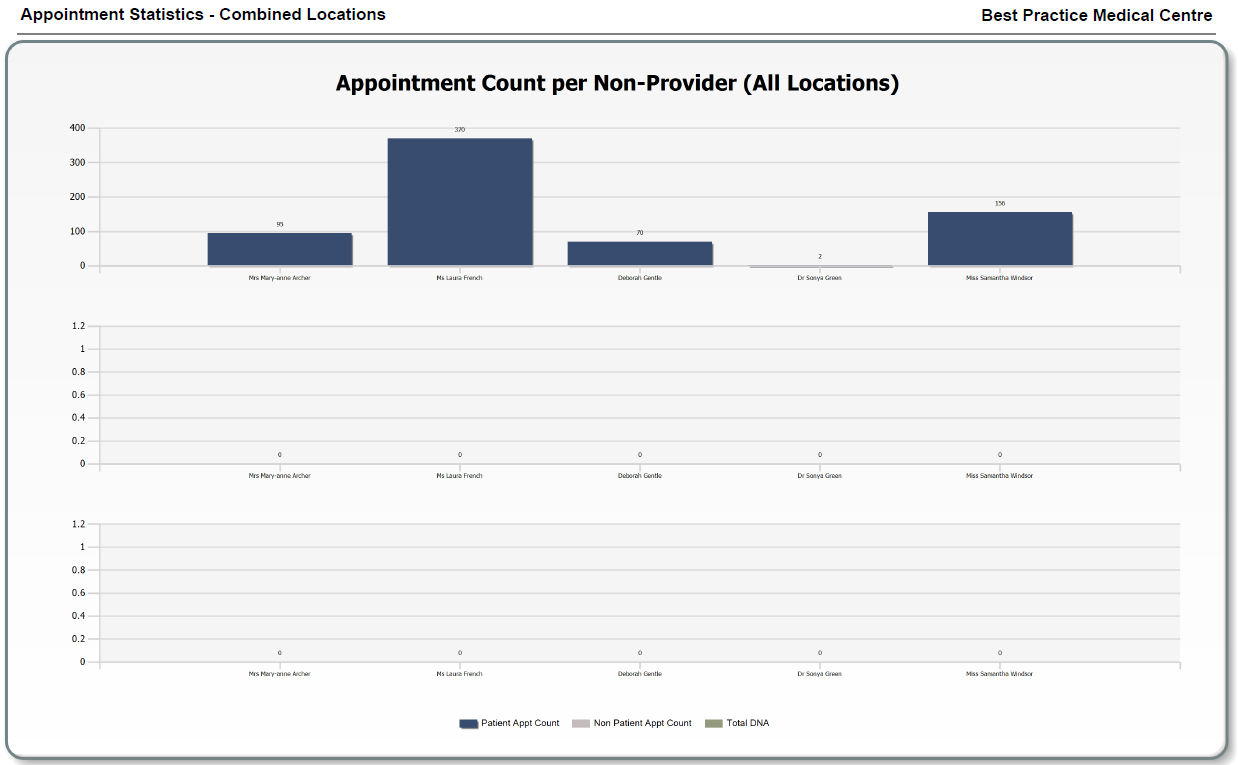
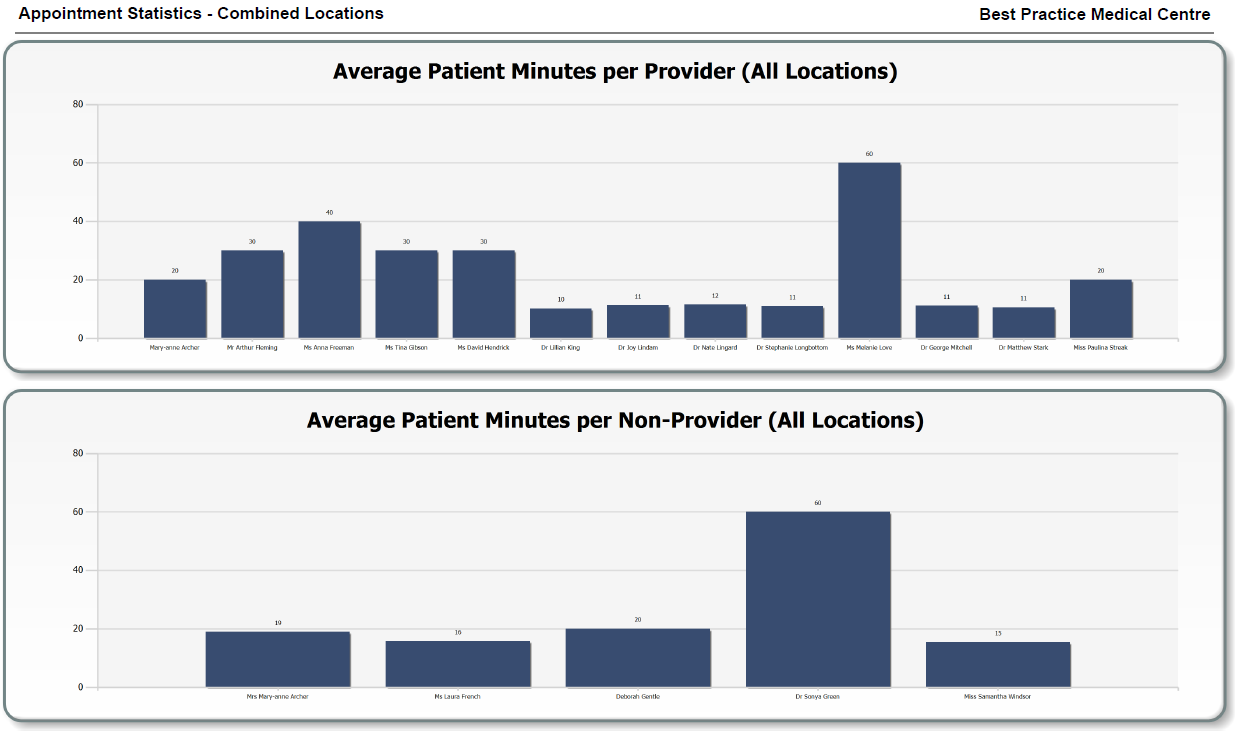
The appointment statistics reports include graphs generated from appointment data listed above. These include:
- appointment count per provider
- appointment count per non-provider
- average patient minutes by provider
- average patient minutes by non-provider
- average patient waiting minutes per provider
- average patient waiting minutes per non-provider.
The individual locations report will print a separate graph per location whereas the combined locations report will combine statistics for each provider together.
Below are some examples of how these graphs may look (click images to enlarge).
|
|
|
|