
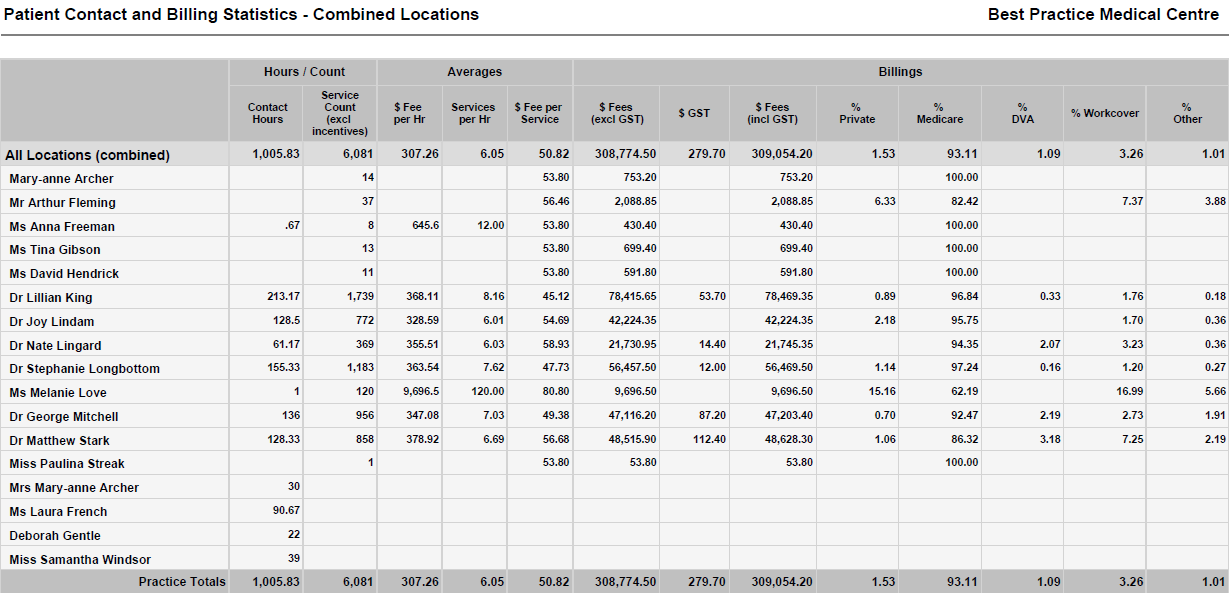
The Patient Contact and Billing Statistics reports provide statistics on patient contact hours, a count of services performed, average fees per hour, services per hour and fee per service, plus the dollar values of fees billed.
There are two Patient Contact and Billing Statistics reports available: combined locations and individual locations.
The statistics in the reports are grouped by either all locations or individual location depending on the report viewed, then provider, then date.
Report sections
Contact hours
Contact Hours are based on the appointment length where an appointment is linked to a visit, or where there is a visit within 60 minutes of the appointment start time; otherwise the duration is based on the actual visit length.
Service count
The service count counts services with dates that are in the specified date range, and excludes incentive items. This count is used in the services per hour and fee per service averages.
Averages
Averages are provided for Fee per hour, Services per hour and Fee per service.
Fees
Fees are calculated for service dates within the specified date range and include incentive items. They are broken down into Fees excluding GST and including GST, amount of GST if applicable, then into columns per account type, such as Medicare or private.
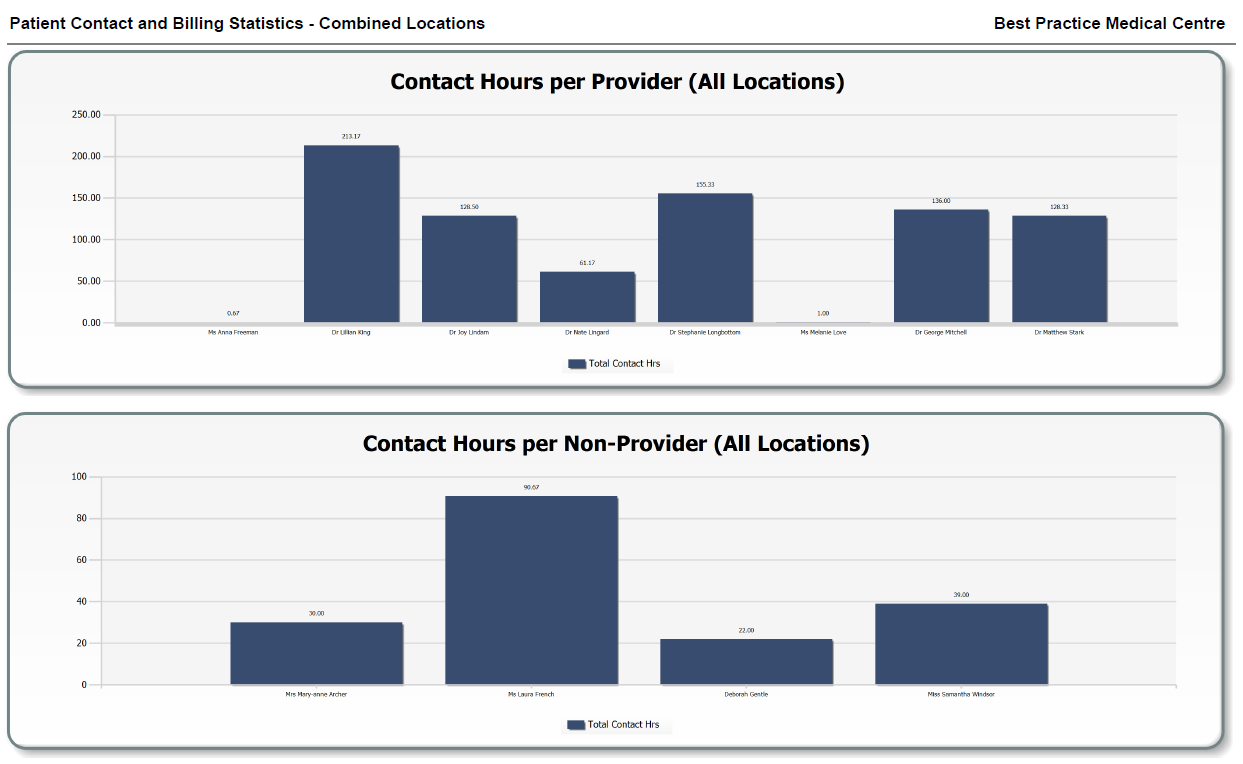
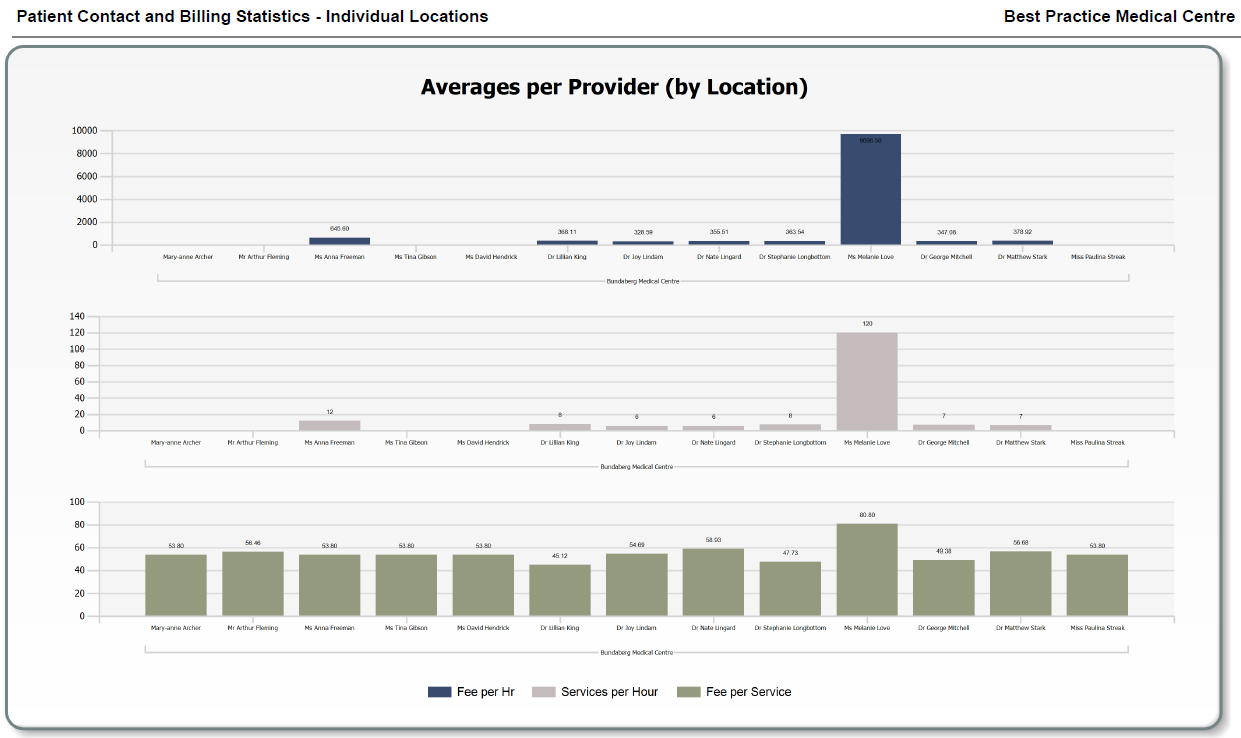
Graphs
The Patient Contact and Billing Statistics reports include graphs for contact hours, service count, and averages, broken into providers vs non providers.
Below are some examples of how these graphs may look (click images to enlarge).
|
|
|